There are many reasons why I think that a Synology Diskstation NAS is a perfect all-in-one private cloud platform.
It keeps your precious family photos and documents safely stored in a RAID system and it runs your local services as well as your home automation system.
Therefore, my Synology NAS evolved into a critical backbone, running several important services within my house, such as the open source home automation system or a spam filtering proxy server.
As the Synology private cloud device now represents an important part of my private IT infrastructure, I was investing some time to come up with the perfect way of monitoring its activity and availability and to alert on abnormal behaviour by using Dynatrace, Telegraf and SNMP.
Observable through SNMP and Docker
One of the most outstanding features of a Synology Diskstation is to directly run Docker images on the Network Attached Storage (NAS).
Please be aware that Docker does not run on all Synology models! So this blog relates to all Synology Diskstation models that are based on Intel CPUs and that are capable of running Docker containers (DS-218+, FS1018, RS3618xs, DS918+, DS718+).
This also allows us to build a Docker image that contains a Telegraf agent which then can directly be run on a Synology device.
As the majority of all network devices, also the Synology Diskstation offers to expose critical telemetry data, such as network load, memory consumption, cpu activity and temperature through SNMP (Simple Network Management Protocol).
The Telegraf agent offers both, a plugin for grabbing the locally exposed SNMP telemetry data from your Synology device as well as a convenient plugin to send this information to Dynatrace in order to analyze and alert on anomalies.
I already pre built a tiny Docker image which contains all necessary components to continuously monitor your Synology Diskstation and to send the information to your Dynatrace environment.
Within the next section I will show how to download, configure and run this Docker image.
Pull and configure the Diskstation monitoring image
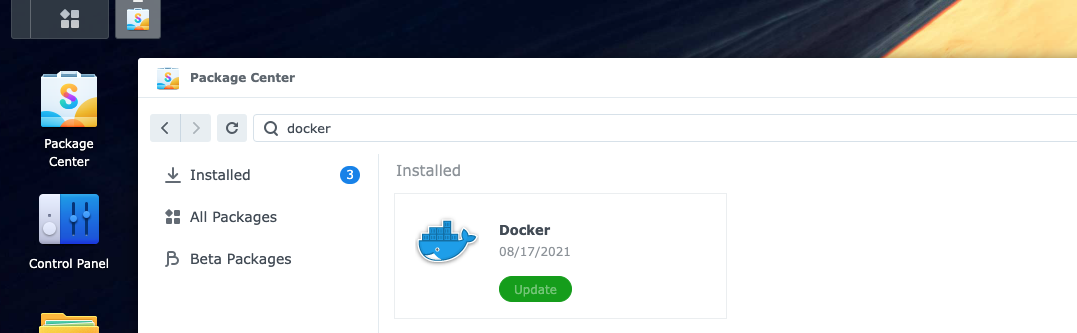
If you not already using Docker on your NAS, please install the Docker package from your Synology administration console, as it is shown below:
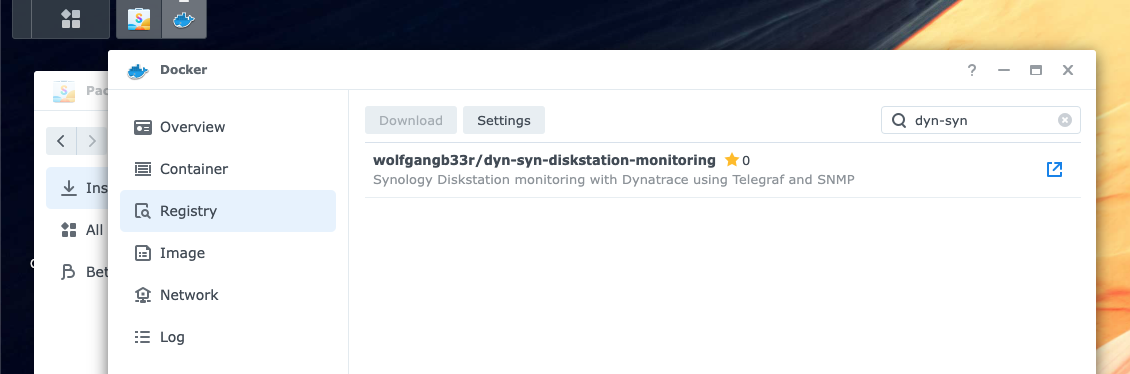
Once, the Docker package is installed, you can open the Docker console and click on the image registry to download my pre built Telegraf image, as shown below:
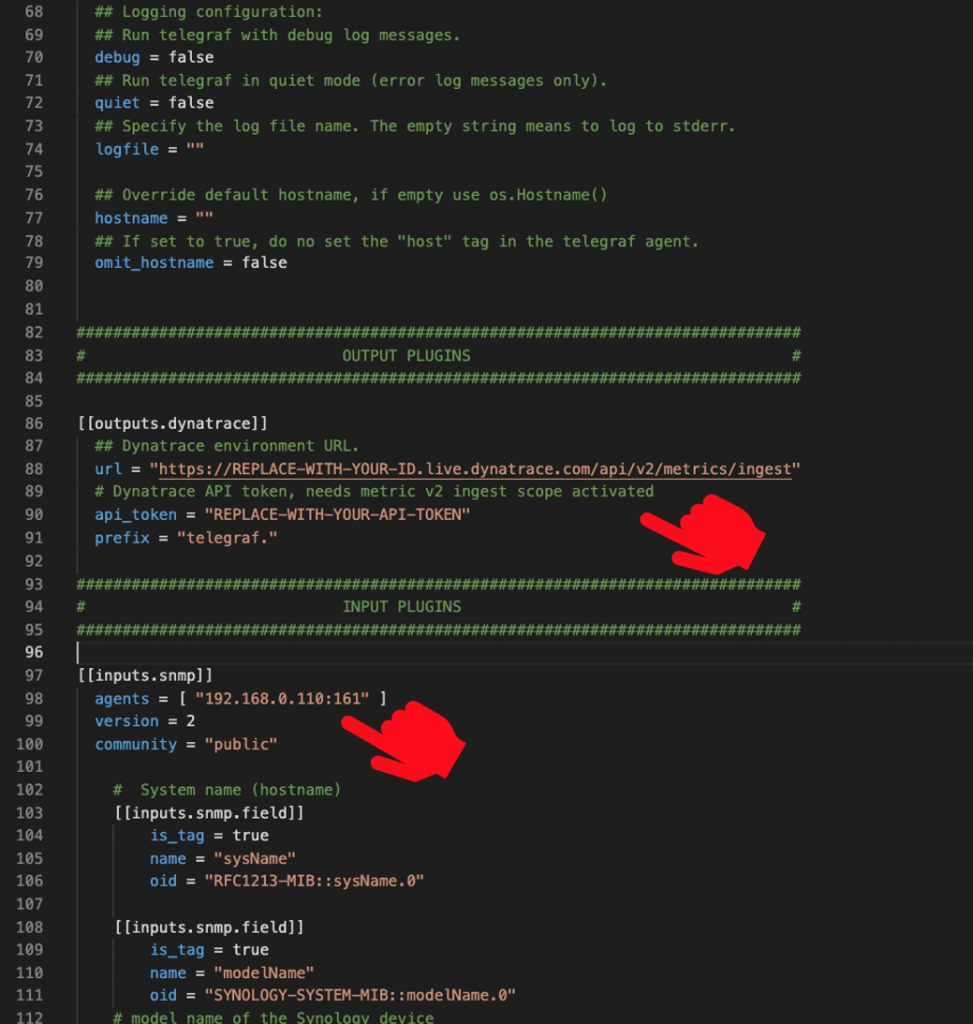
Telegraf agents are configured by providing a configuration YAML file that contains all the plugin configuration as well as the necessary information about the Dynatrace environment you want to send the telemetry data to.
See the below screenshot of the necessary Telegraf configuration file that shows where to put in your own configuration. You need to replace your own Dynatrace environment endpoint along with a Dynatrace API token that has metric v2 scope enabled.
Furthermore, you need to replace my local Synology IP address with the IP address of your own Synology disk.
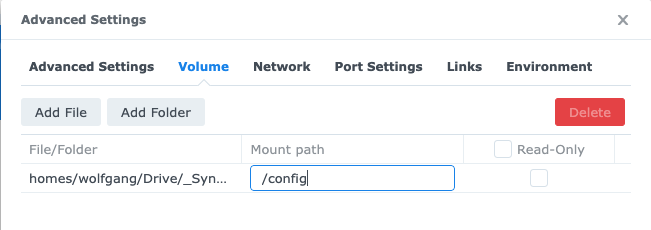
Now that we have prepared the Telegraf configuration file, we can start the Docker container by mapping the folder where the container expects the local configuration file.
Please mind that the config file must be named telegraf.conf and the mapped folder needs to be named /config.
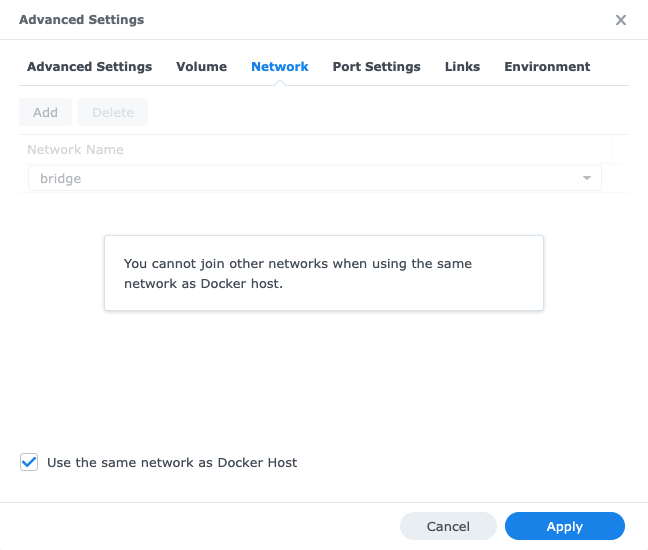
The Docker container must run in the same virtual network as your Synology disk is running, so that it is able to grab the SNMP information. Therefore, you have to tick this checkbox during the startup configuration of your monitoring Docker container:
Once you finish the startup configuration of your monitoring Docker container and it is successfully running on your Synology NAS, you can switch to your Dynatrace environment in order to review all telemetry data in context.
All Data in Context with Dynatrace
Now that the monitoring container sends a constant stream of SNMP telemetry data into my Dynatrace environment, I can review all the incoming data in a larger context.
Let’s first review all the Synology telemetry metrics that are streaming into Dynatrace, as you find those within the Dynatrace metric browser:
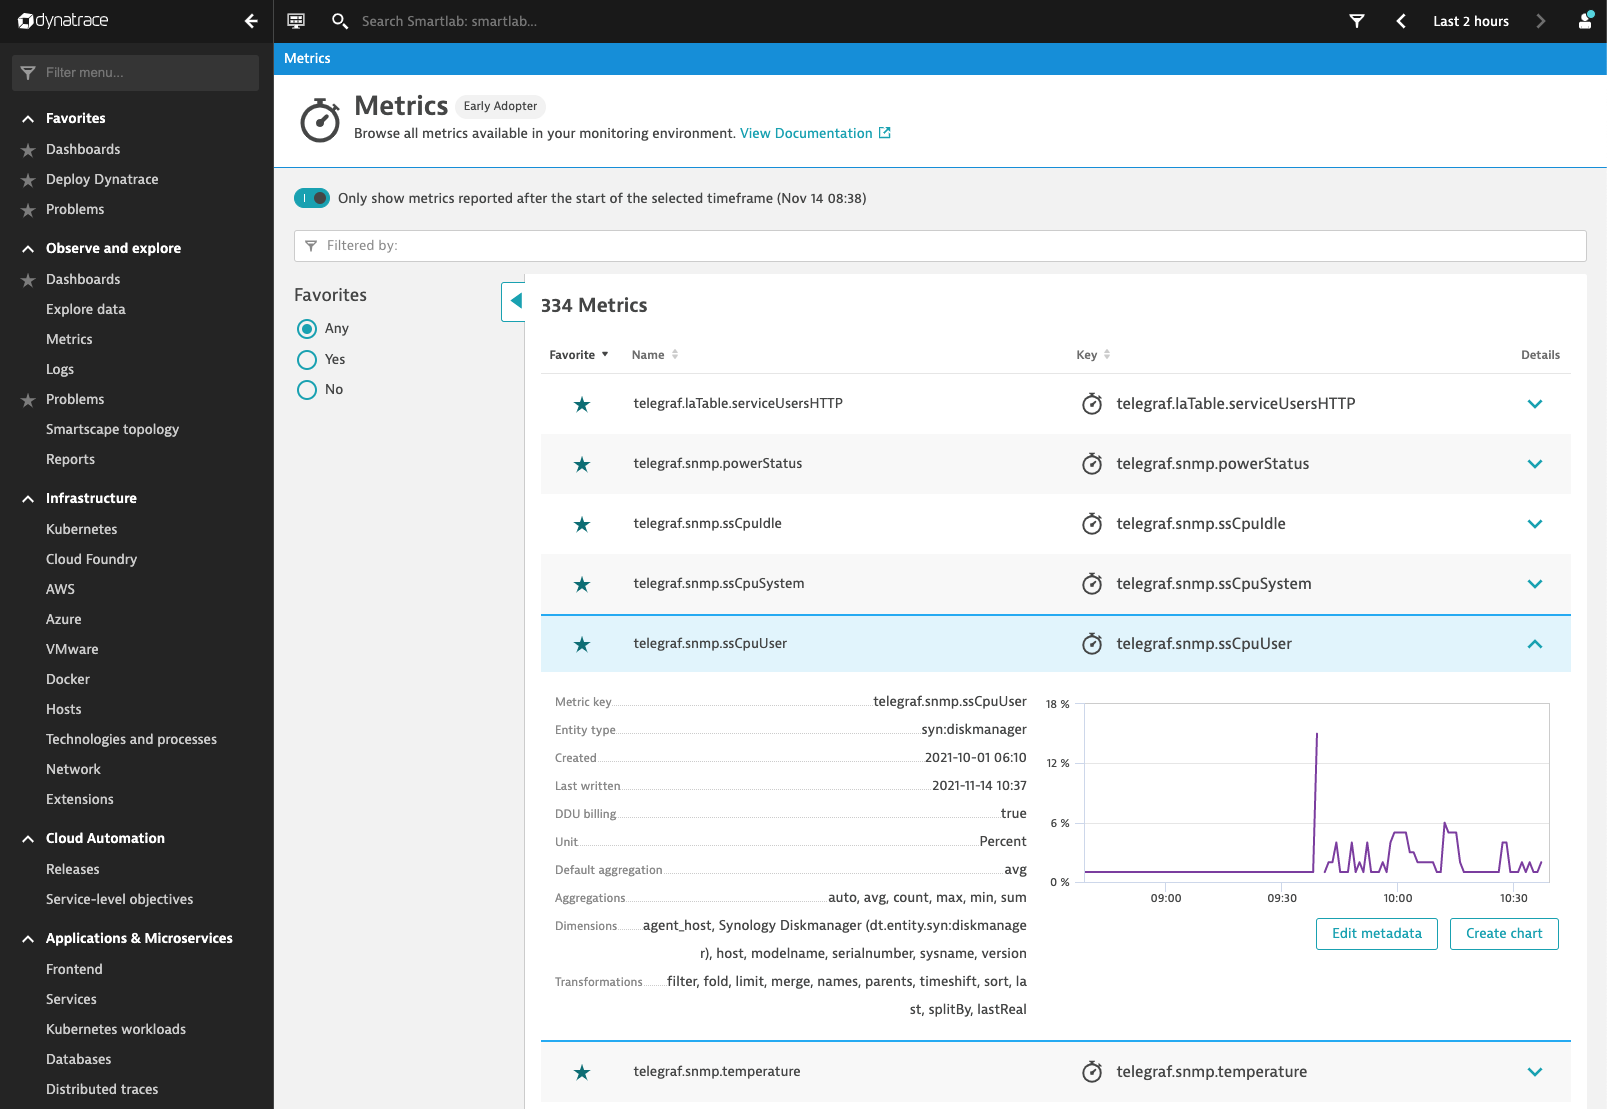
All those metrics are split by Synology Diskstation as well as by individual disk, depending on the given information.
The Dynatrace Data Explorer allows you to slice and dice into the individual Synology metrics and to identify interesting dimensional cohorts.
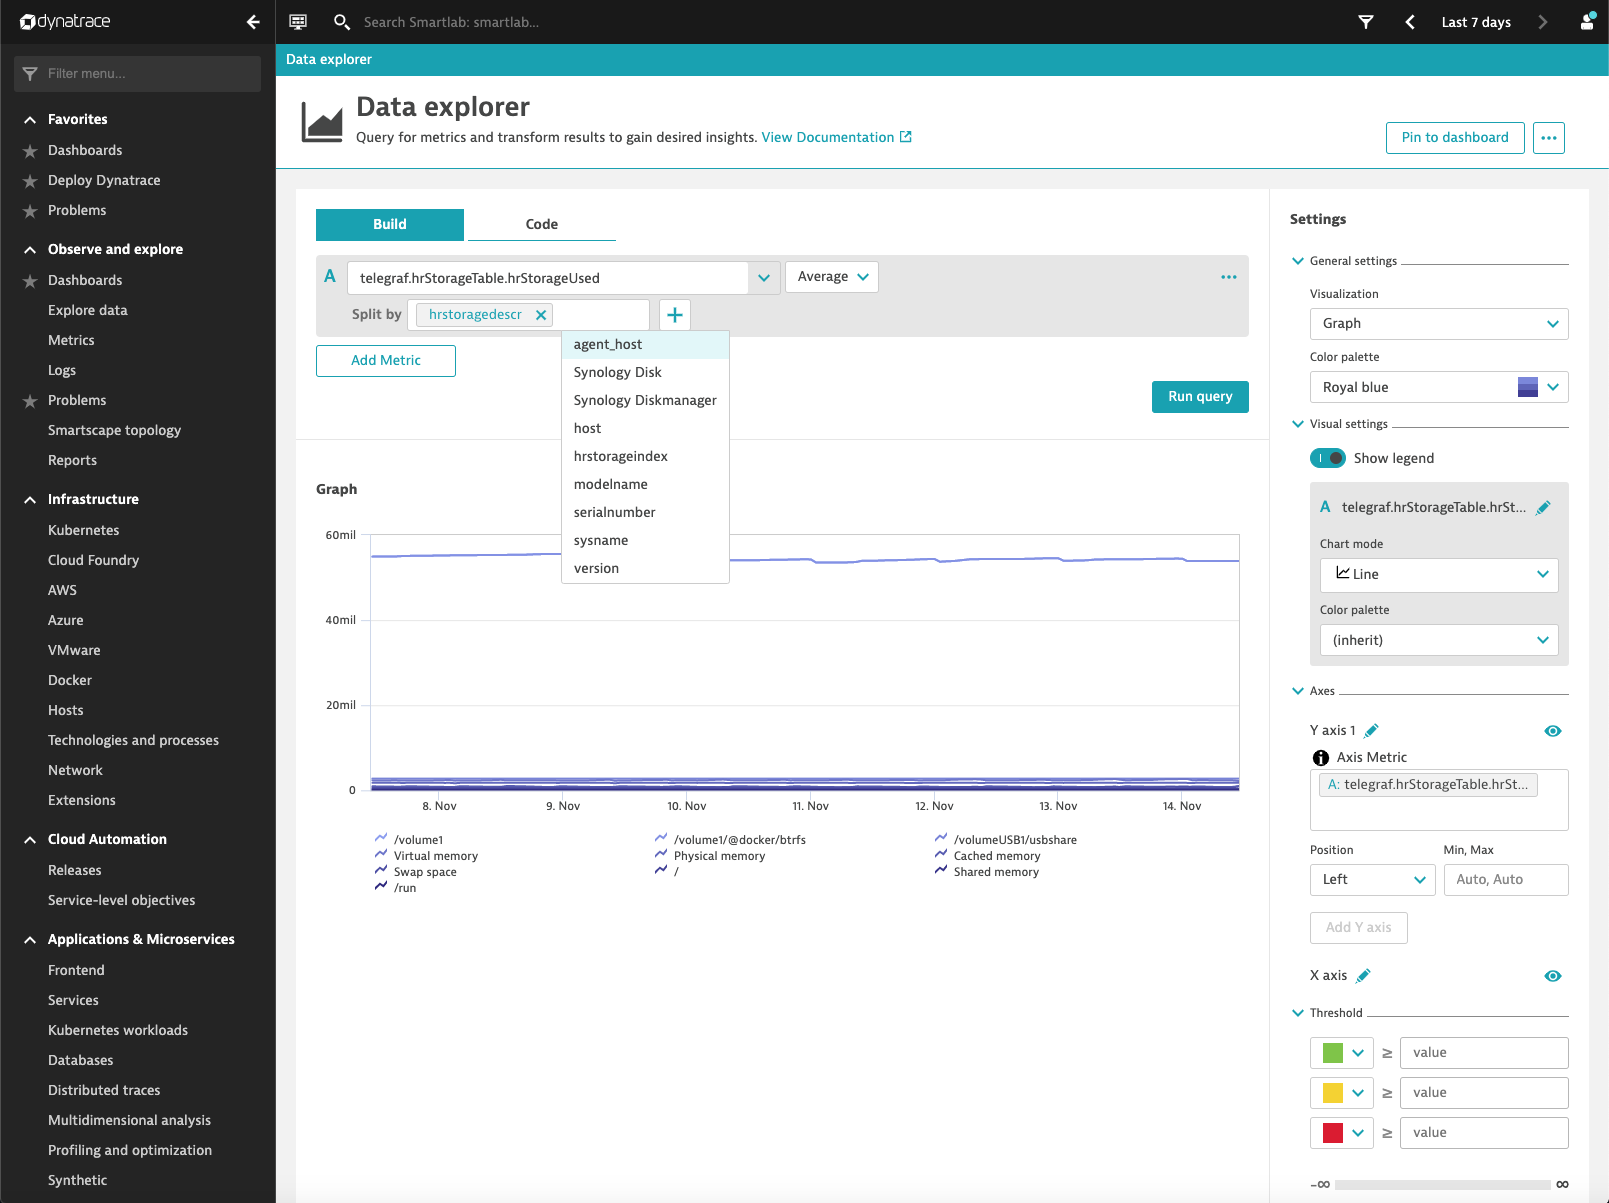
All those incoming telemetry metrics deliver useful dimensional information, such as the Synology Diskstation serial number, it’s version and its hardware model.
In case you would like to deploy that monitoring container to hundreds of individual Synology Diskstations, those dimensions are used to identify which device is responsible for which line within the chart.
Additionally, you can use the Dynatrace topology model to automatically discover and extract individual entities and to put them into a larger context.
Discover a Synology Topology Model
When Dynatrace ships out-of-the-box technology support, they are using Extensions 2.0 to simplify configuration and large scale rollout across thousands of environments.
The same Extension 2.0 framework is used by Dynatrace technology partners and customers to build and ship their own technology support packages.
The previously introduced Synology Diskmanager monitoring can be seen as a kind of technology support for receiving and integrating network device information seamlessly into existing Dynatrace environments.
As I already built the monitoring Docker container, I also provided an example for a companion Dynatrace Extension 2.0, which can be found on my GitHub repository.
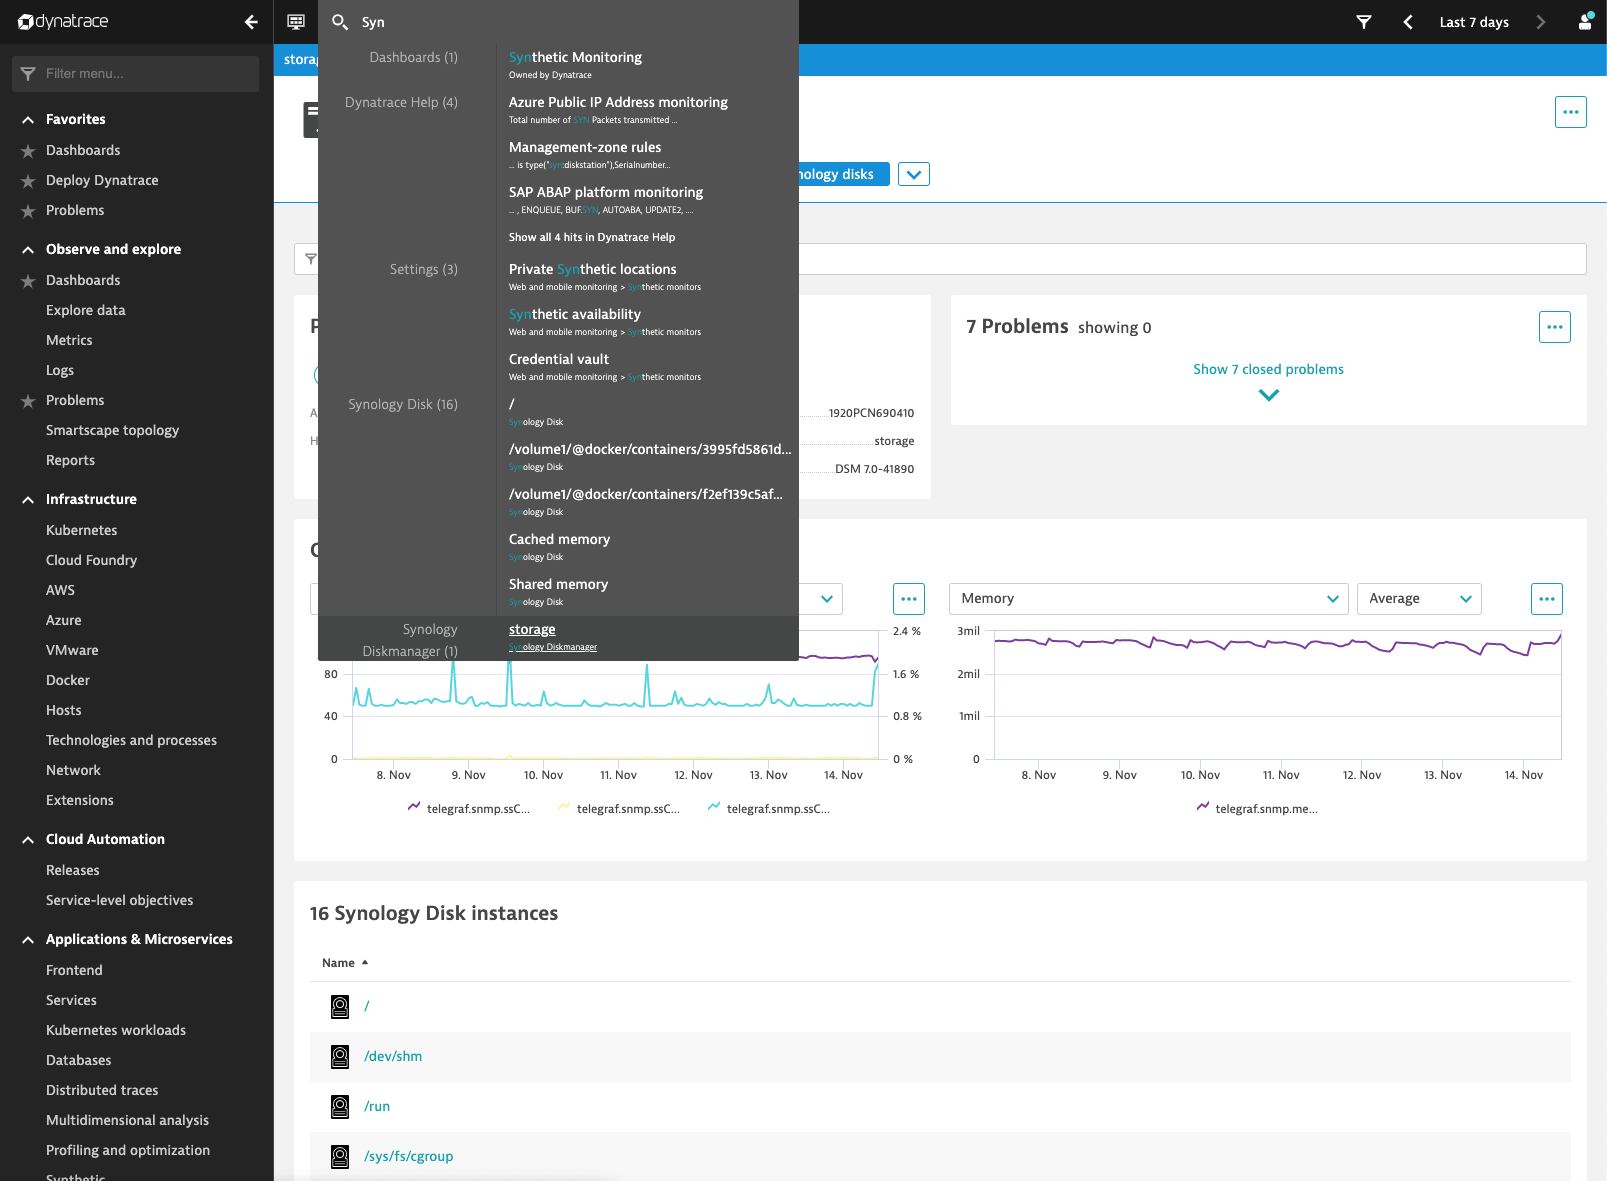
After installing this Synology Extension, you are able to address all your Synology Diskstations by type and name, as it is shown within Dynatrace.
Alert on Anomalies and Analyze Root Cause with Dynatrace Davis
The ultimate goal of the exercise within this blog post is to not only monitor a Synology Diskstation but also to alert on abnormal system behaviour, such as high CPU consumption.
As all of the telemetry information is already available in Dynatrace, we can set up an anomaly detection configuration that allows us to alert on abnormal CPU consumption.
Within Dynatrace navigate to Settings > Anomaly Detection > Custom events for alerting and choose one of the Synology metrics as shown below:
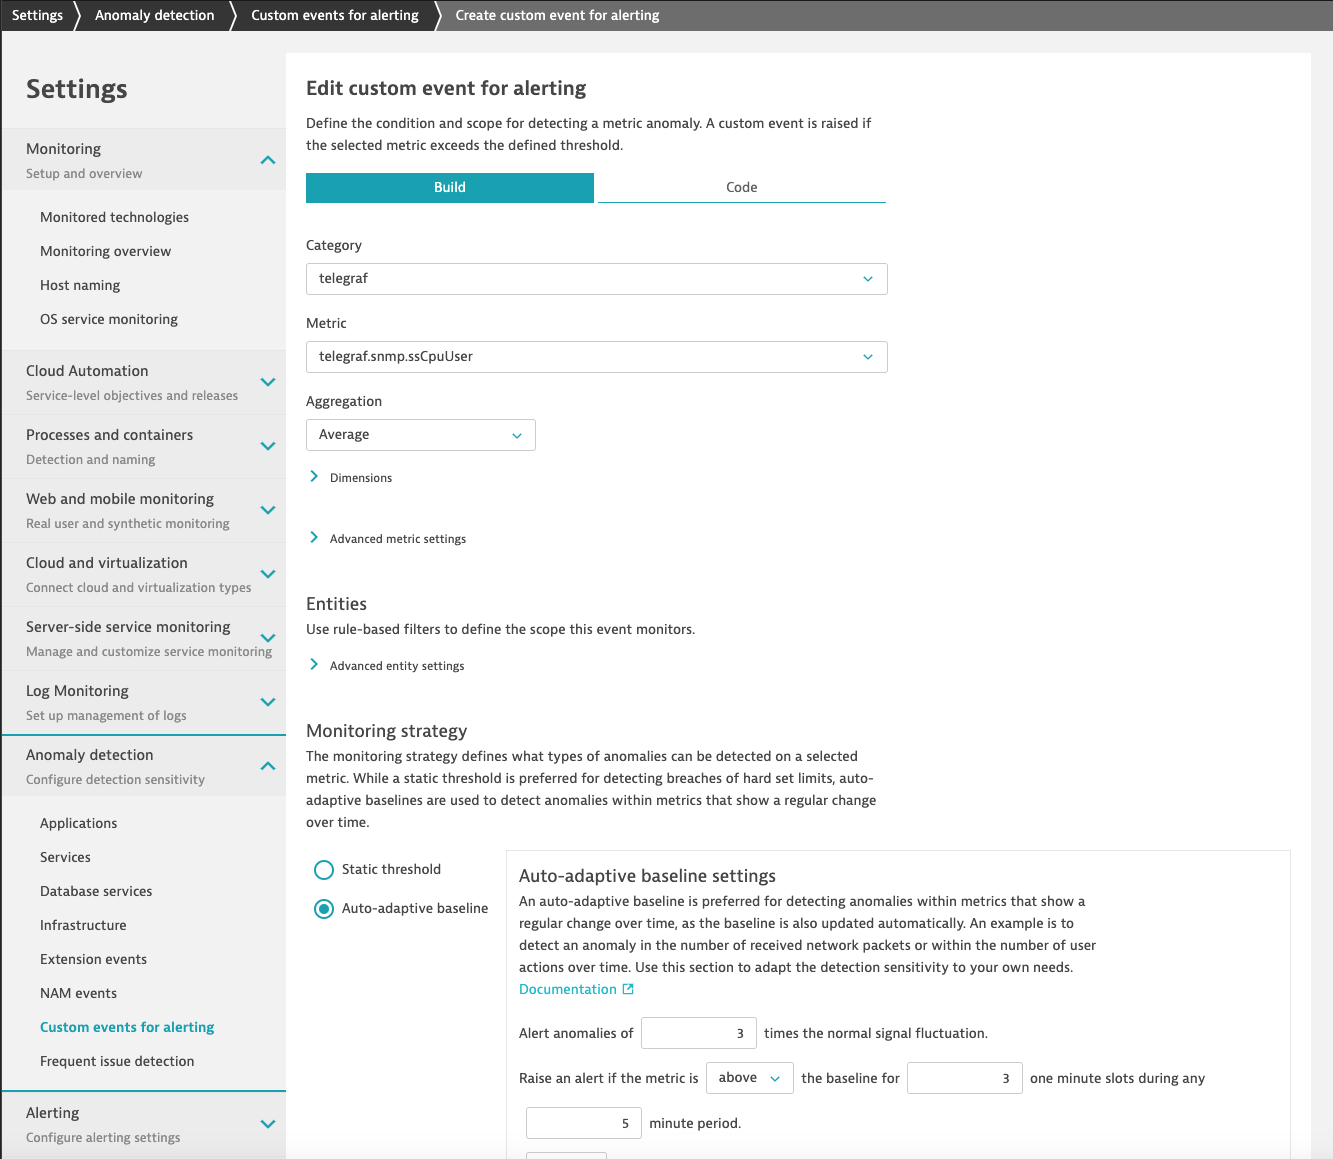
Once the metric is set, Dynatrace automatically reviews the past metric behaviour in order to recommend the best fitting automated baseline or threshold to detect anomalies.
The alert preview gives you a quick preview on how many abnormal states this set up would have reported in the past 24 hours.
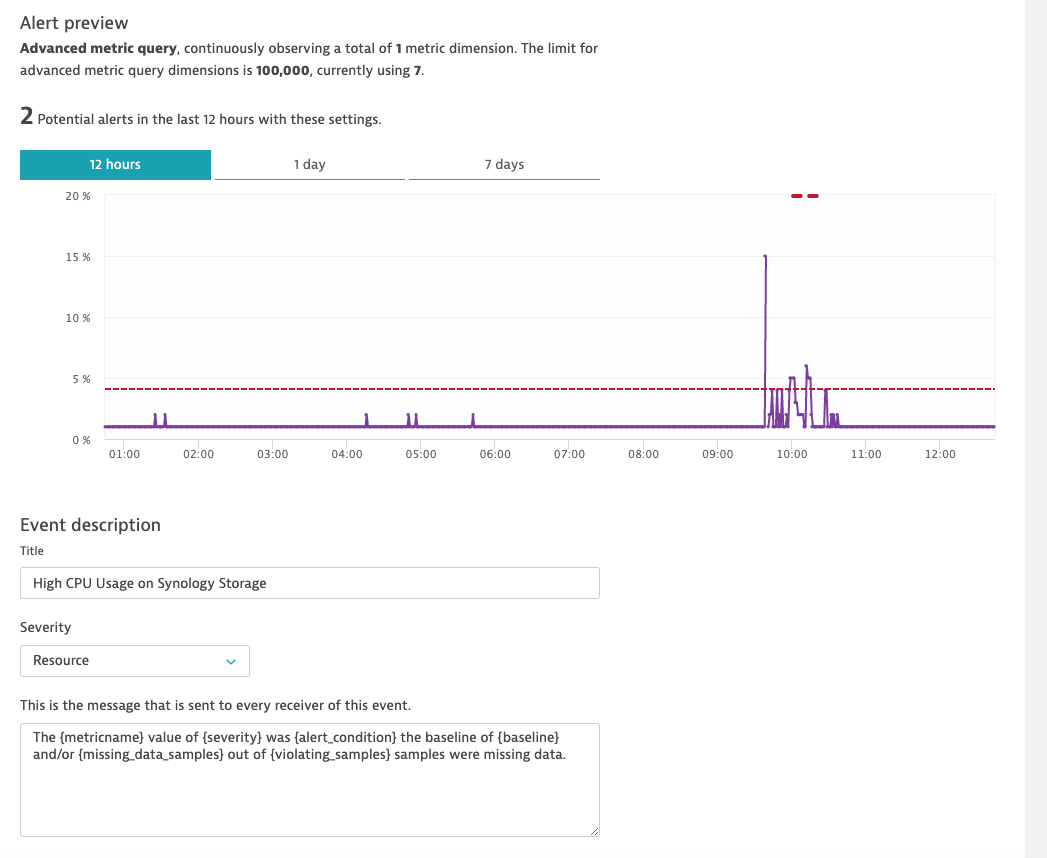
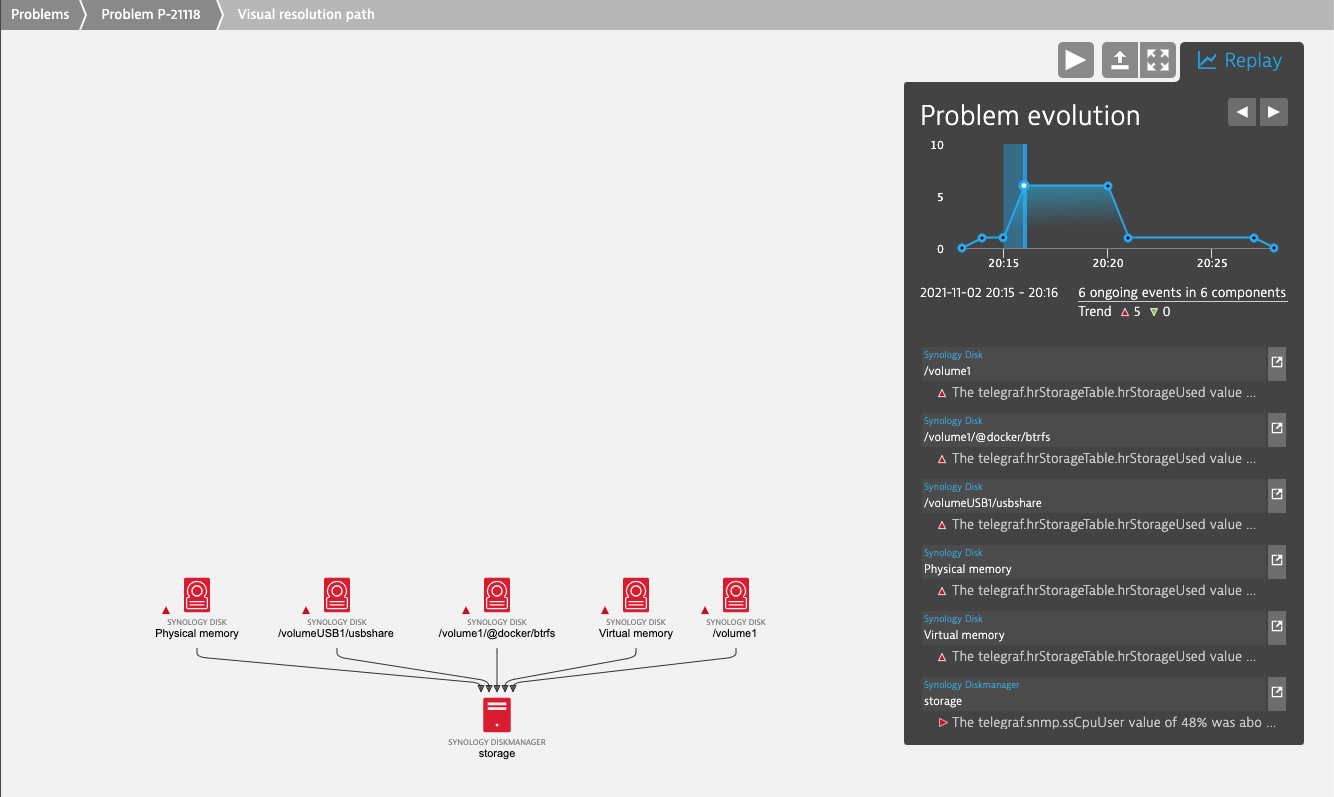
After the configuration, Dynatrace will automatically detect any abnormal system behaviour within one or all of your monitored Synology Diskstations, as it is shown below.

Using Dynatrace’s unique capability of extracting the topology context, the alert can also combine the anomalies’ relevant dependencies into a consistent incident topology and replay.
Conclusion
This blog post showed how to combine the unique capabilities of Dynatrace with SNMP telemetry data coming from a Synology Diskstation to automatically alert on abnormal system behaviour.
By deploying a Telegraf agent within a Docker container directly on your Synology NAS observability information can be streamed to your Dynatrace environment without much effort.
Using the Dynatrace capability of extracting context in terms of topology directly from your Synology metrics along with the anomaly detection capability, you can safeguard your NAS against mission critical outages.
In case you would like to see a demo of the Synology monitoring in Dynatrace, watch the Performance Clinic.