Developing and publishing mobile apps within global marketplaces such as iTunes or Play Store is a tough business, where many companies fail.
The definition and monitoring of strategic targets by using service-level-objectives (SLO) helps to keep up stability and performance of your app and therefore safeguards your app revenue stream.
Customer expectations concerning your app’s performance and reliability are extremely high and competition is eager to exploit any tiny release glitch within your app.
Automated testing and launch reports help to identify stability or performance issues before you hit the release button and before those issues lead to annoyed customers and bad marketplace reviews.
Positive marketplace reviews are the new currency that allows your app to reach a top rank within marketplace search results that is directly proportional with an increase of your revenue stream.
Once released, a critical bug crashing your newest app version on a cohort of devices will immediately lead to a higher number of frustrated app users and to a flood of bad reviews.
Choose Service-Level Indicators (SLI) that indicate business health
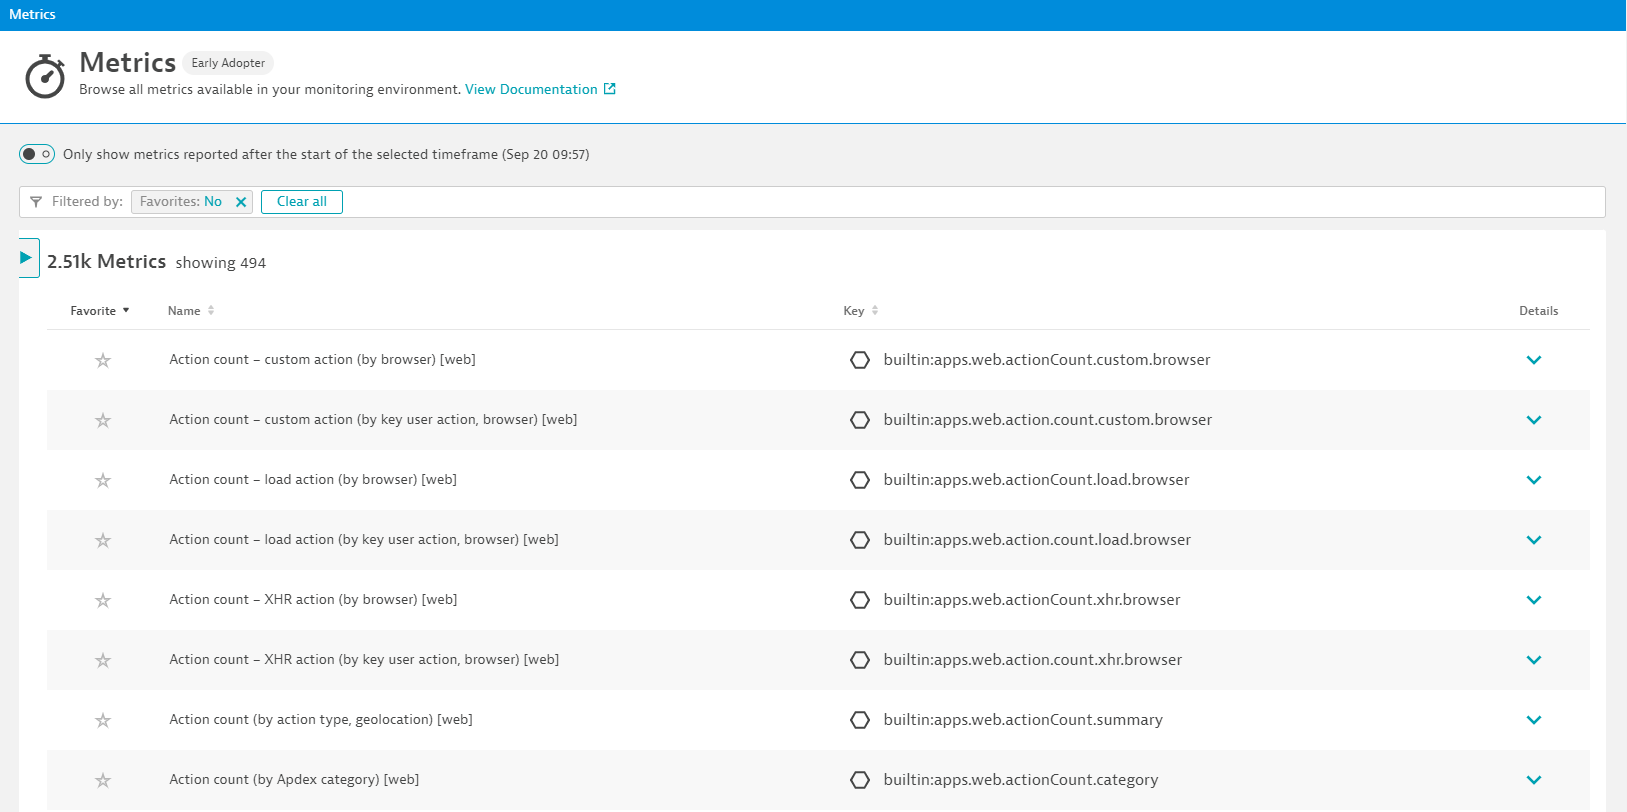
Today’s observability and monitoring platforms, such as Dynatrace offer thousands of individual indicators for the stability and performance of software.
Many of those indicators are collected and measured over time as a metric which results in a large bunch of time series that continuously quantify the state of your applications and services, as it is shown within the Dynatrace list of monitored metrics below.
As modern, highly-dynamic deployment systems, such as Kubernetes do not lack telemetry metrics, Google came up with Site-Reliability-Engineering best-practices to safeguard software service delivery without drowning in metric alerts.
The same SRE principles can be used to safeguard your mobile app delivery by using out-of-the-box Dynatrace capabilities.
As a first step within this process, you have to decide on metrics that represent good indicators for the business health of your applications.
How to measure mobile app stability?
In many cases, the mobile app’s crash free users percentage represents a good, out-of-the-box indicator for the stability and reliability of your mobile app.
See below the Dynatrace measured metric for the percentage of crash-free users of my own application:
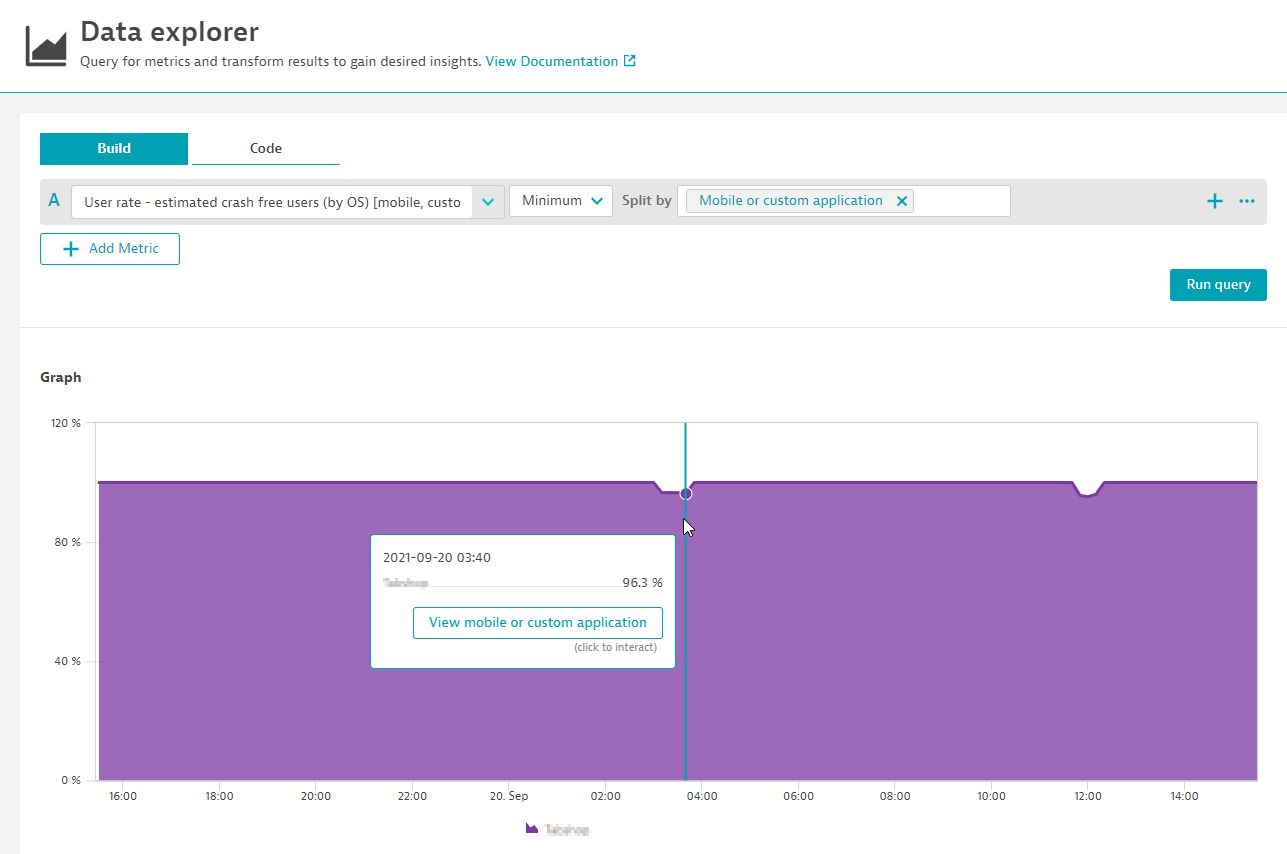
As you can see within the chart above, my mobile application is pretty stable for nearly 100% of all its users. Only sometimes, very rarely a user crashes the app by either hitting some unstable feature within the app or by using a device type (out of the 12K supported ones) where the app is having a stability issue.
Every new application version introduced and released to the app store can of course dramatically change that nice view above and to kill my business revenue.
For me the rate of crash free users is one of the most important stability indicators for my mobile app and its value correlates well with the number of bad marketplace reviews my app gets within the Google Playstore.
What about the app’s responsiveness?
It’s crucial to deliver a perfectly stable and reliable mobile app, point one. Another challenge is to measure how much time your app users spend waiting for your UI to deliver the demanded information, such as loading product information in a shop or receiving a message in a social media app.
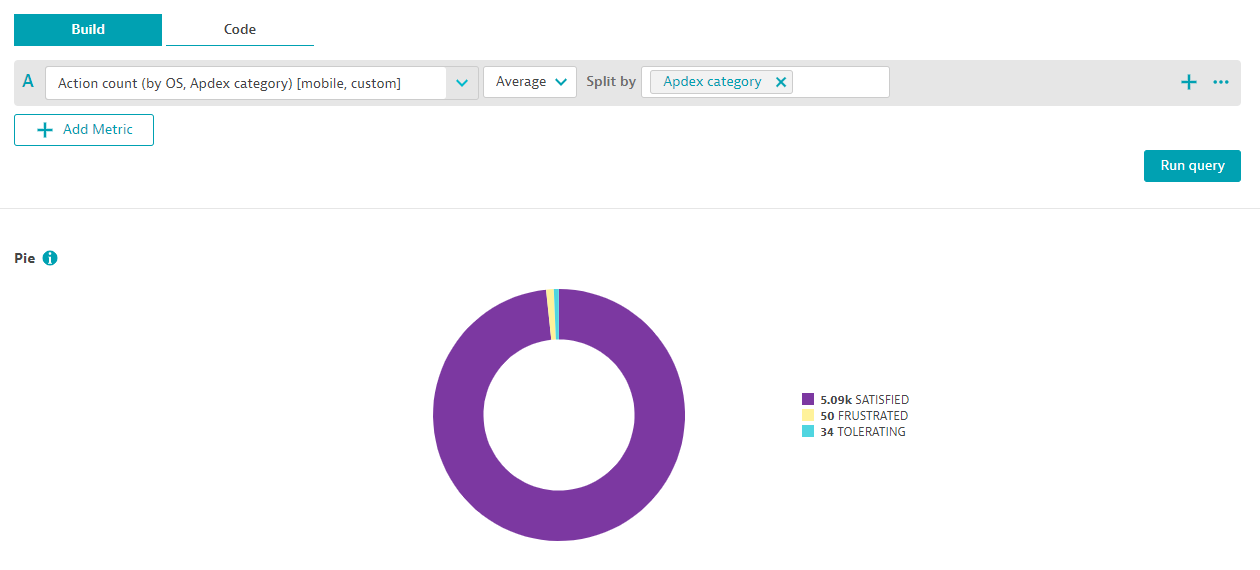
A widely-used metric for measuring an application’s user experience is using the Apdex (Application Performance Index). This normalized measurement categories all user’s actions into three main categories, which are Satisfied, Tolerated and Frustrated.
Now that Dynatrace is automatically delivering those numbers for us, we can easily use the percentage of satisfied users as a business-relevant SLI metric and build our Service-level-objective on top.
See below the chart of all three Apdex category counts for my mobile application:
As we just finished the selection of our business-relevant Service-level-indicator metrics, we can go a step further and define our stability and performance objectives.
Define your Service-Level Objectives (SLO)
Within the previous sections we focused on the selection of metrics (SLIs) that represent good indicators for the health of your business.
Now let’s define two objectives that we would like to achieve in terms of mobile app stability as well as application Apdex responsiveness.
All SLOs are normalized towards percentages, where our percentage of crash free users already fits in pretty well and does not need any further transformation.
The metric can be used directly within the Dynatrace SLO configuration screen, where you also have to define the observation period as well as your target value.
To summarize, an SLO always consists of following three parts:
- An SLI metric normalized to a percentage
- An observation period
- A target value
Let’s assume we want to achieve a stability goal so that 99.9% of all users within an observation period of one day are not crashing within your app.
That’s a pretty tough goal, as it means that less than 1 out of 1000 unique users a day are crashing!
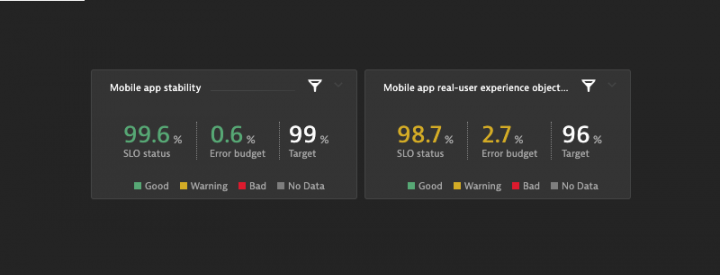
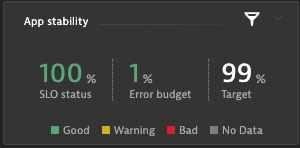
See below the Dynatrace configuration screen for configuring that stability SLO, where I chose a less strict target of 99%.

Once we pin the configured app stability to our dashboard we see that we still have 1% error budget left within the last 24 hours, which proves a great app stability.
Let’s do the same for our Apdex application usability measurement, which is also available as a Dynatrace SLO indicator.
The Apdex metric is a bit more complex as it is not given as a percentage out of the box within Dynatrace. In this case we will transform the count metric into a percentage of Satisfied users compared to the total number of users.
The Dynatrace wizard already configures that calculation, by dividing the Satisfied users by the total number of users multiplied by 100, as it is shown below:
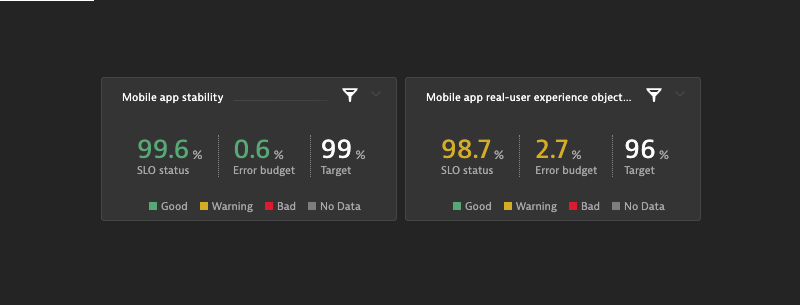
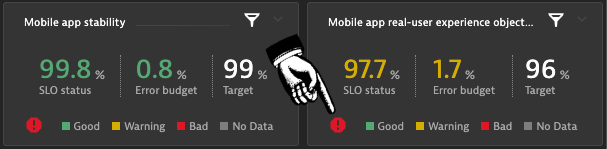
Within our dashboard both our mobile app SLOs are shown side-by-side. While the stability of our app is great, the Apdex SLO appears in warning state, due to a slow responding user actions.
See below both mobile app SLO tiles within a Dynatrace dashboard:
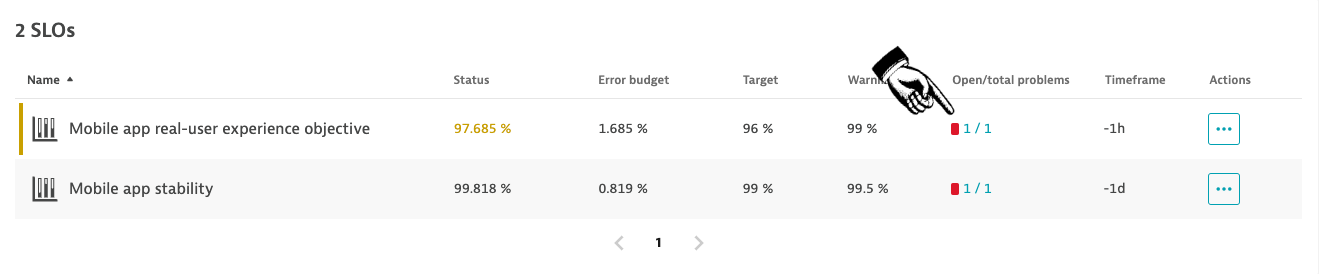
All critical SLOs for your mobile app are then listed within your Dynatrace environment, as it is shown below:

Besides showing your SLO on a dashboard and keeping a close eye on their health status, we also want to trigger an alarm and use the Dynatrace AI to further analyze the root-cause of a violated SLO target.
Alert on SLO violation
Within Dynatrace, custom events are used to set up anomaly detection for any given metric or metric expression.
In our case, we want to raise an event whenever the SLO target is violated, but use a shorter, more aggressive time window.
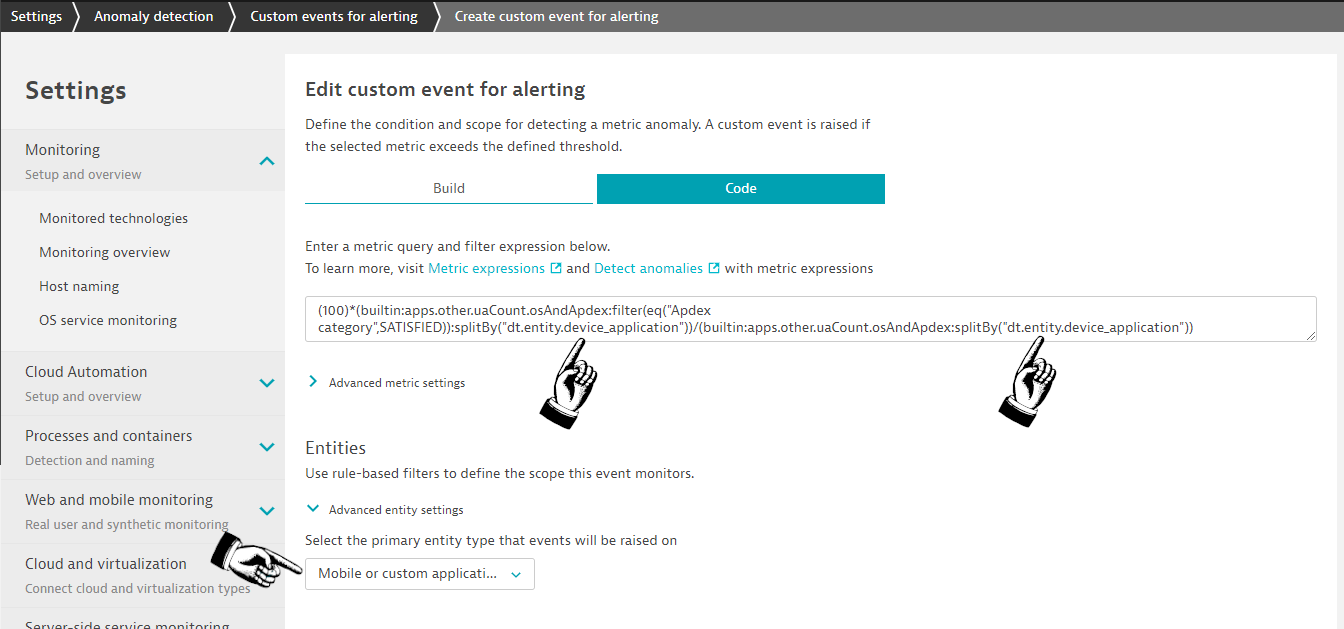
Within Dynatrace, navigate to Settings > Anomaly detection > Custom events for alerting and open the configuration screen, where you copy and paste the metric expression that was also used within your SLO definition.
The configuration screen consists of multiple logical sections, where you enter the SLO metric within the first section, along with a splitBy() by application and a selection of the entity type mobile or custom application you would like to raise the event for. The splitBy() statement within the metric is essential for the Davis AI, otherwise the metric is merged and aggregated on environment level as well as the event that is raised.
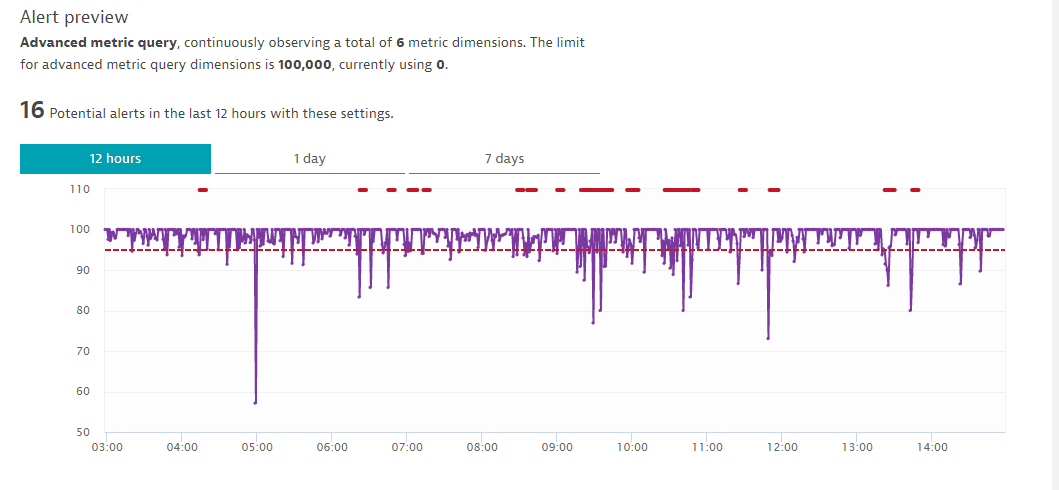
After configuring the SLO threshold of 95% and an observation period of 3 out of 5 minutes, we can see an alert preview that estimates how many events would have been raised with that configuration.
You can play around with the observation period to reduce the sensitivity if the event config appears too noisy.
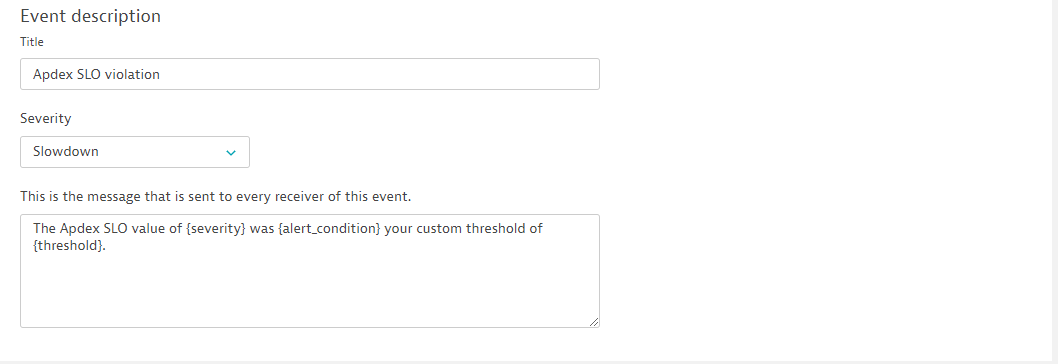
Within the last section of the configuration screen you specify the event title along with a human readable description and the event type, such as slowdown or availability.
Within our example I chose the slowdown type for our Apdex SLO events, while I chose the availability event type for the stability crash SLO.
This event type is then used by the Dynatrace AI during the root-cause analysis process to find either slowdown relevant causes or stability related causes.
Leverage AI to show Root-cause
Within Dynatrace, the so-called Davis AI root-cause engine automates the analysis of detected SLO violations.
Whenever our configured SLO event is raised to indicate the violation of our SLO target, the AI engine kicks in and follows all the relevant topology, analyzes all information in context and tries to find a root-cause for the degradation of stability or of the Apdex performance.
As all traces are analyzed and followed automatically, also the slowdown of a backend service can be identified as the reason for a given SLO event, which helps to pinpoint root-cause faster, especially within large-scale service infrastructures.
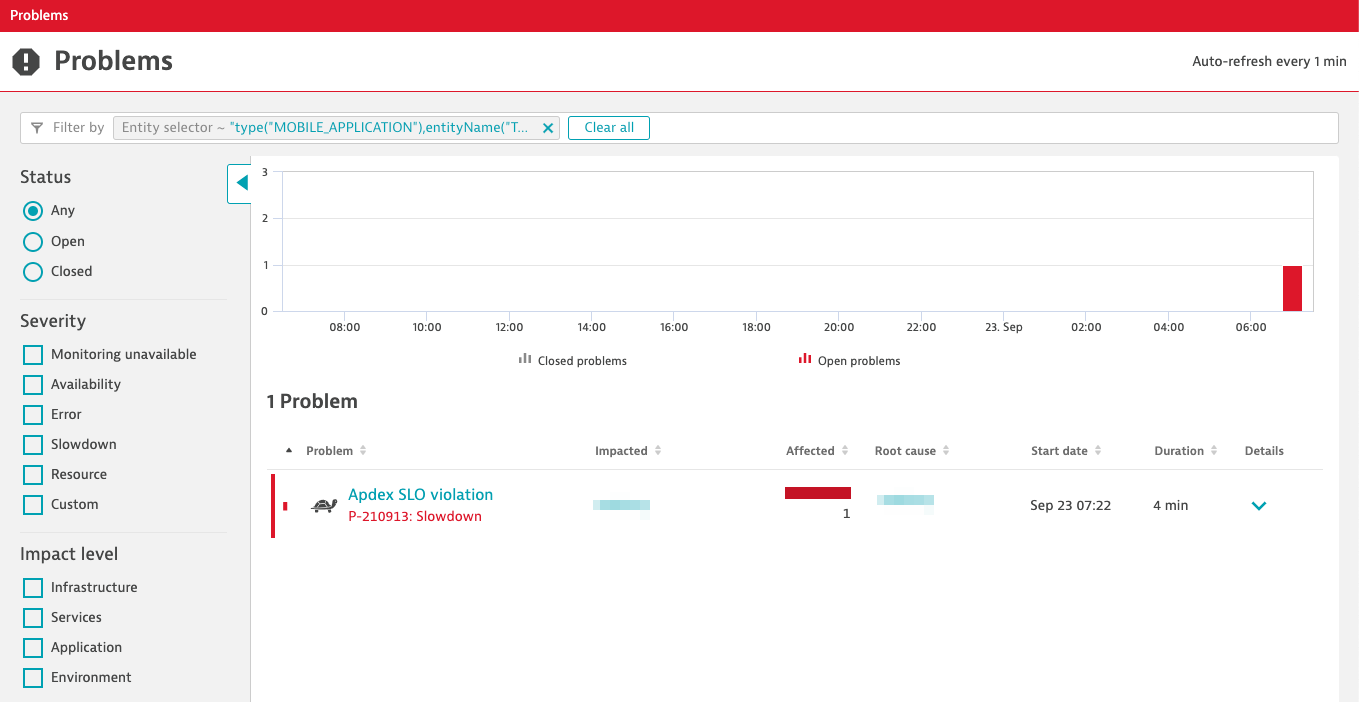
In case the AI automatically detected an incident for the given application, all the relevant SLO dashboard tiles show a critical indicator, as it is shown within the screenshot below.
A drill down reveals the list of SLOs along with the number of AI reported incidences that are currently active or that were active considering the SLO observation period.
A click directly leads to the incident list, which shows that our previously configured Apdex event was raised to indicate that our SLO target value was violated.
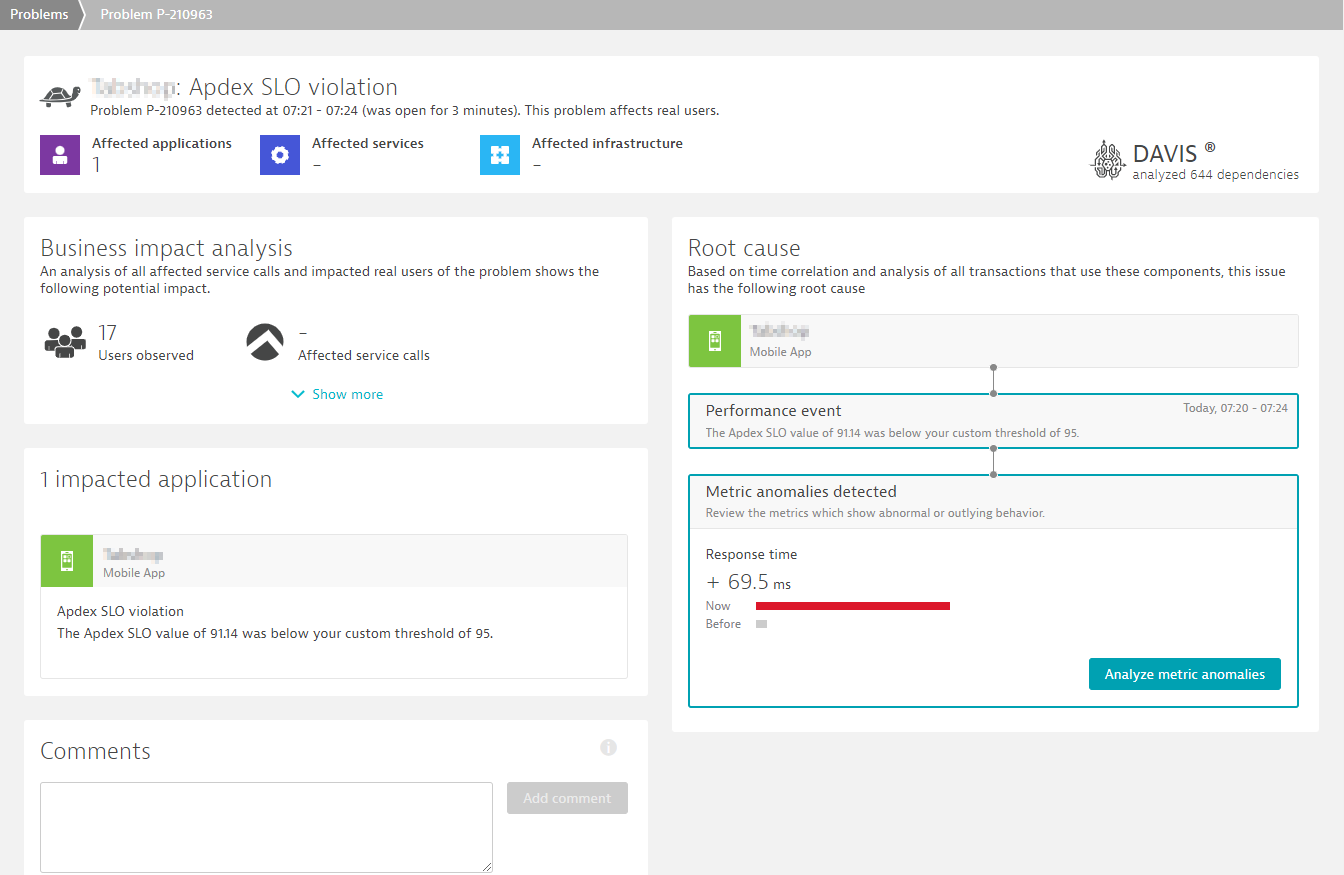
Mind that the AI already opened the incident directly in context of your application and that the incident shows all the relevant information such as the number of impacted topological entities as well as what it identified as being the root-cause entity.
Once the Dynatrace AI kicks in and analyzed all your mobile apps relationships and dependencies into your backend services, it shows a report, highlighting the root-cause as well as the impact in terms of which users had active sessions during the SLO breach.
In my example case, the app does not have any critical backend service dependencies, so the SLO breach root-cause is caused by the response time degradation of the mobile app user actions, as it is shown below:
Conclusion
Publishing mobile apps within global marketplaces and to defend your top rank within marketplace search is a hard business.
Using SLOs to closely monitor important business indicators and to define targets for your app’s stability and usability helps to keep up the quality while incrementally releasing new features.
Automatically alerting on SLO target violations helps to mitigate any risk that comes with faulty app releases, where the Dynatrace AI adds additional speedup through its automatic root-cause detection.
Using SLOs to safeguard your business revenue is a great enhancement over traditional alerting on hundreds of individual infrastructure metrics. Instead of drowning in individual infrastructure alerts, your team can focus on the most important business-relevant health indicators and react much quicker when something goes wrong.