Artificial-Intelligence and machine-learning models are trained, tested and used with their accuracy in mind and therefore its crucial to closely observe and monitor your AI model during the design phase.
TensorFlow offers a convenient way to attach a TensorBoard callback hook to your machine-learning model to receive and visualise the training and test performance of your model.
Now as TensorBoard is really a great tool and I use it a lot, for production systems this approach is less useful, as TensorBoard is built for the design and dev stage of your AI model.
In production, you want to attach a stable monitoring platform, such as Dynatrace to closely watch the thrift of your prediction models over time, when confronted with new or changing input data.
Last week I came across a convenient way to write your own callback listener that automatically receives the metric logs of your model during all stages and forwards this information to Dynatrace.
Find the necessary TensorFlow to Dynatrace callback class on GitHub.
It’s extremely simple to register such a Dynatrace callback listener, as it is shown below:
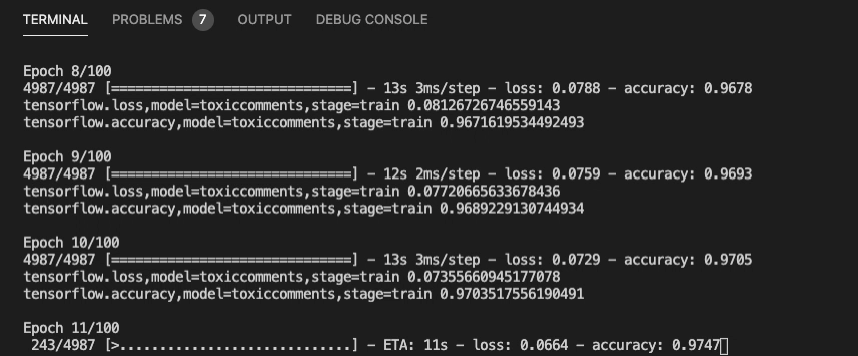
dt_callback = DynatraceKerasCallback(metricprefix='tensorflow',modelname='model', url='https://your.live.dynatrace.com/api/v2/metrics/ingest',apitoken='yoursecret') model.fit(x=train_texts, y=target, epochs=100, callbacks=[dt_callback])Then start training your model, as shown below:
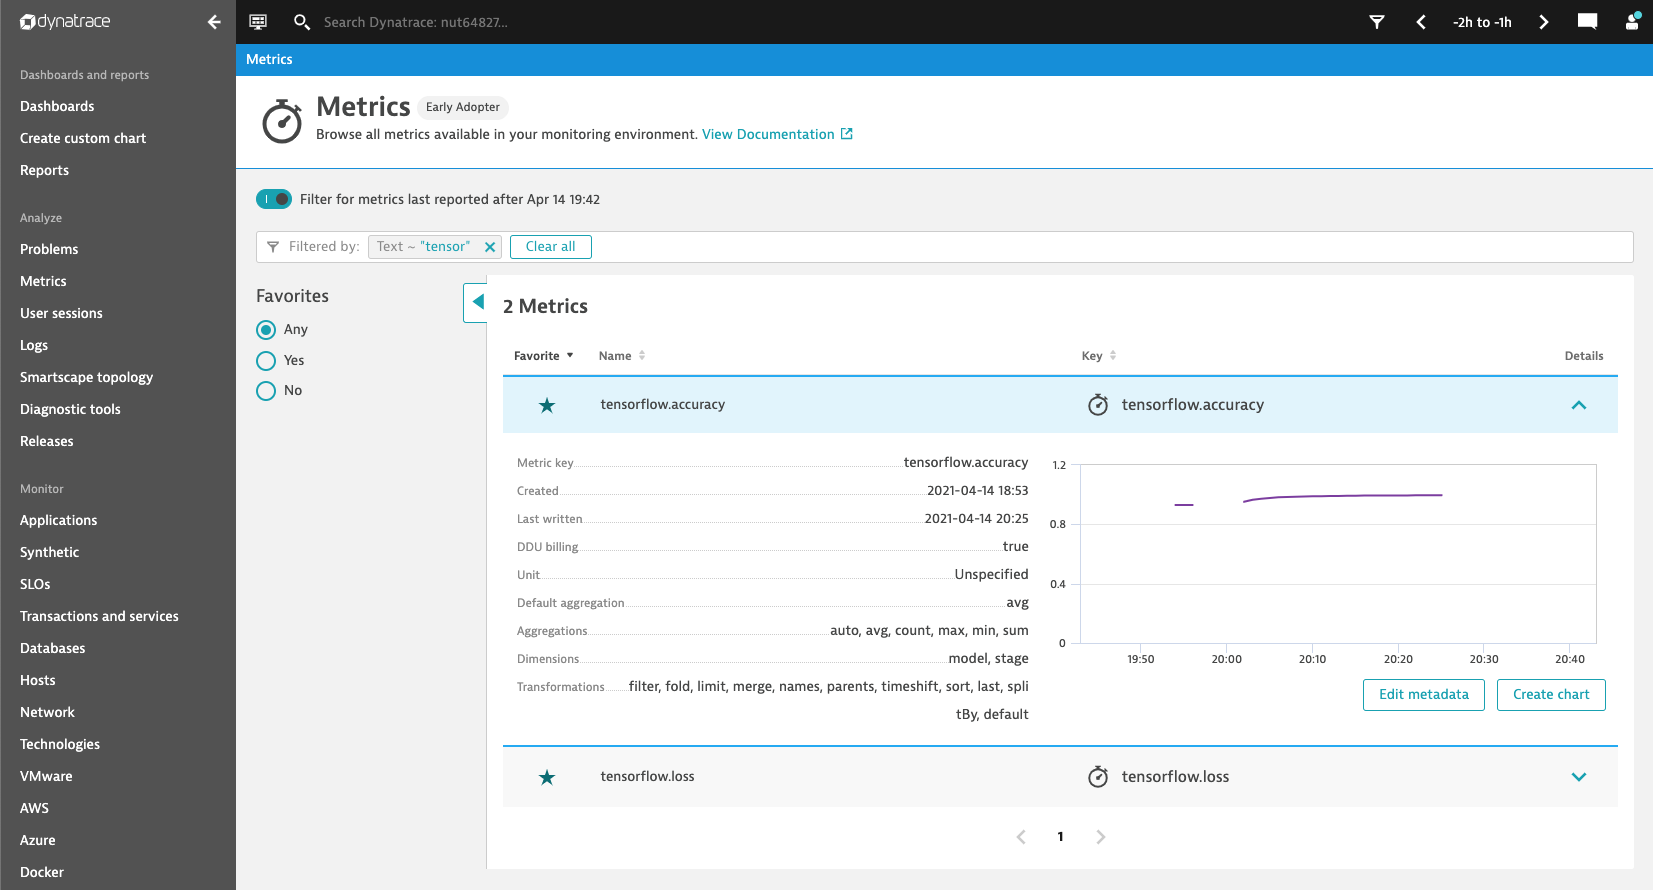
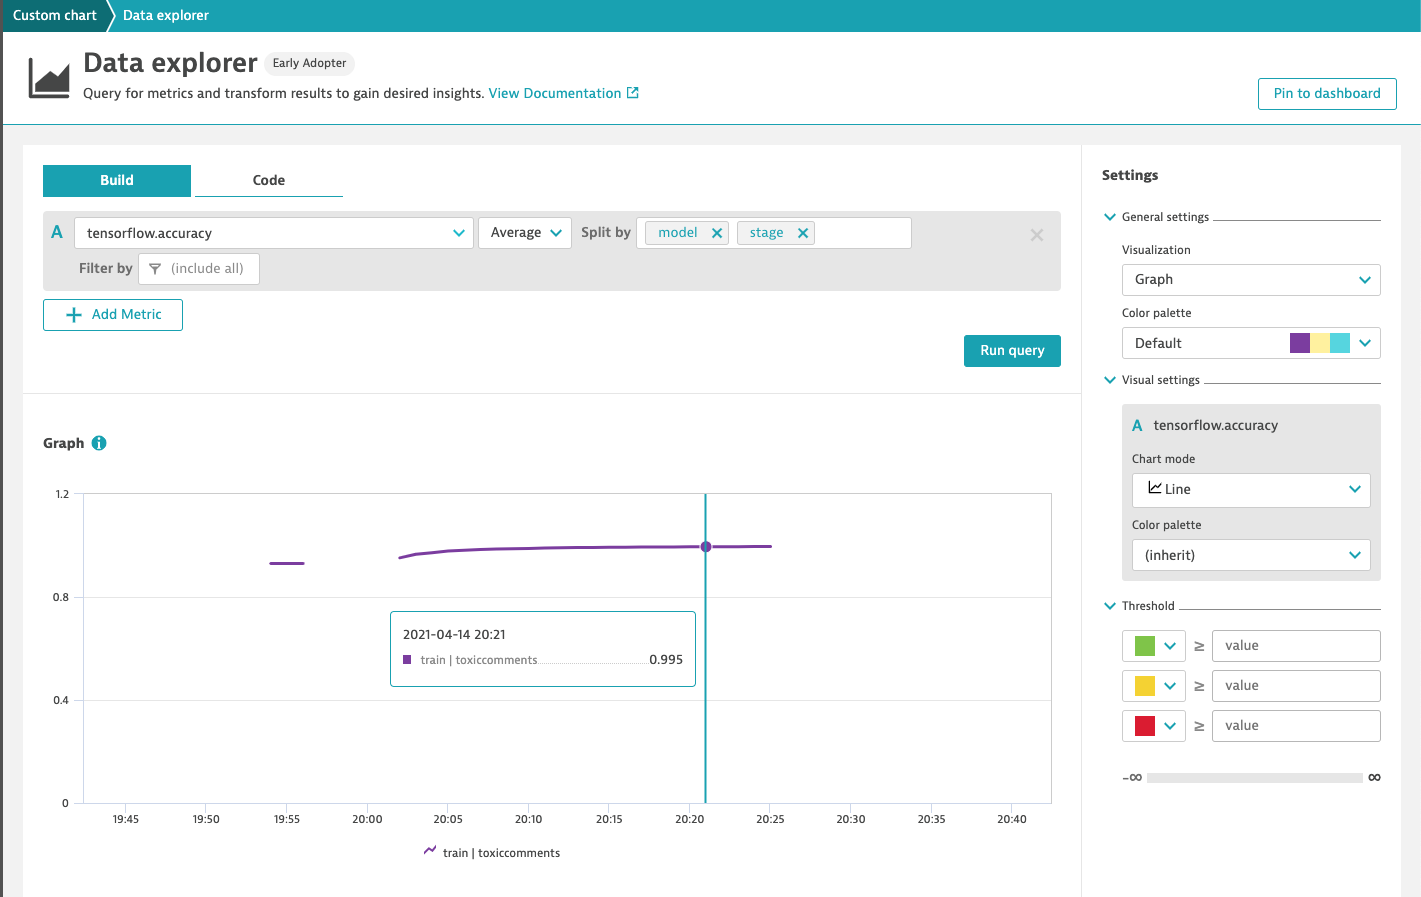
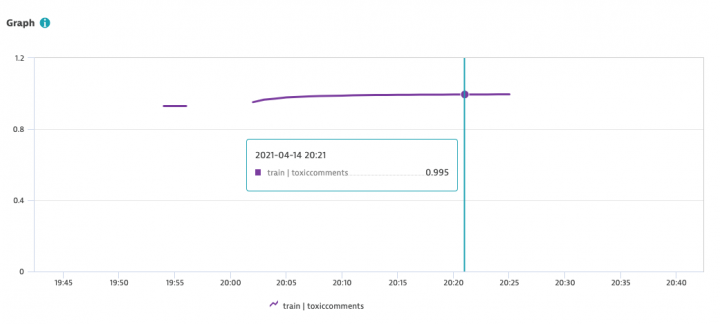
As the Dynatrace callback was registered before the training stage, the TensorFlow metrics are now shown in Dynatrace: