It’s common knowledge today that seamless monitoring and observability of all your production software stacks is key for successful service delivery. Along with a tight integration into your CI/CD pipeline, service and software monitoring offers a lot of insights on what is going wrong during your build, test and release workflows and how to quickly remediate outages.
As a Cloud Native SaaS platform, GitHub represents the home of most of the popular Open Source projects worldwide. It offers all the important features that are necessary to support the entire software lifecycle of your project.
GitHub Actions is one of those priceless features, as it allows you to choose from more than 6.000 individual CI/CD steps that allow you to automatically build, test and release your projects on virtual machines.
Dynatrace on the other hand represents the leading software observability and intelligence platform according to analysts, such as Gartner. A Dynatrace monitoring environment allows you to closely observe the production behaviour of your software in realtime and to get notified about abnormal incidences that could lead to outages.
That said, its pretty obvious that a tight connection between your GitHub CI/CD pipeline with your Dynatrace monitoring environment offers a lot of benefits.
Within my last project I did implement a purpose built Dynatrace GitHub action that allows you to directly push information, such as events and metrics into your monitoring environment.
Use-cases here are to inform your DevOps team about broken builds of your software or to collect statistics data about your build workflows, such as the number of code commits on your services or the number of failed builds versus successful builds.
You even can use Dynatrace to define dedicated SLOs (Service Level Objectives) for your CI/CD pipeline by using those metrics as Service Level Indicators (SLIs).
See below a typical GitHub build workflow that uses the Dynatrace GitHub Action to push a metric into a monitoring environment and that informs about broken builds as well as on successful builds. Mind that I am sending a total count metric as well as both failed count and success count, which I will use later as SLI metric in my Dynatrace CI/CD Pipeline SLO.
See my GitHub workflow below:
name: 'build-test'
on: # rebuild any PRs and main branch changes
  pull_request:
  push:
    branches:
      - main
      - 'releases/*'

jobs:
  build: # make sure build/ci work properly
    runs-on: ubuntu-latest
    steps:
      - uses: actions/checkout@v2
      - run: |
          npm install
      - run: |
          npm run all

  test: # clean machine without building
    runs-on: ubuntu-latest
    steps:
      - uses: actions/checkout@v2
      - name: Inform Dynatrace about a successful build (
        if: ${{ success() }}
        uses: wolfgangB33r/dynatrace-action@v4
        with:
          url: '${{ secrets.DT_URL }}'
          token: '${{ secrets.DT_TOKEN }}'
          metrics: |
            - metric: "github.build.total"
              value: "1.0"
              dimensions:
                project: "${{ github.repository }}"
                branch: "${{ github.ref }}"
                event: "${{ github.event_name }}"
                owner: wolfgang
            - metric: "github.build.success"
              value: "1.0"
              dimensions:
                project: "${{ github.repository }}"
                branch: "${{ github.ref }}"
                event: "${{ github.event_name }}"
                owner: wolfgang
          events: |
            - title: "Successful Build"
              type: CUSTOM_INFO
              description: "GitHub project ${{ github.repository }} was successfully built"
              source: GitHub
              entities:
                - MOBILE_APPLICATION-C061BED4799B41C5
              dimensions:
                project: "${{ github.repository }}"
                branch: "${{ github.ref }}"
                event: "${{ github.event_name }}"
                owner: wolfgang
      - name: Inform Dynatrace about a failed build
        if: ${{ failure() }}
        uses: wolfgangB33r/dynatrace-action@v4
        with:
          url: '${{ secrets.DT_URL }}'
          token: '${{ secrets.DT_TOKEN }}'
          metrics: |
            - metric: "github.build.total"
              value: "1.0"
              dimensions:
                project: "${{ github.repository }}"
                branch: "${{ github.ref }}"
                event: "${{ github.event_name }}"
                owner: wolfgang
            - metric: "github.build.fails"
              value: "1.0"
              dimensions:
                project: "${{ github.repository }}"
                branch: "${{ github.ref }}"
                event: "${{ github.event_name }}"
                owner: wolfgang
          events: |
            - title: "Failed build"
              type: CUSTOM_INFO
              description: "GitHub project ${{ github.repository }} build failed!"
              source: GitHub
              entities:
                - MOBILE_APPLICATION-C061BED4799B41C5
              dimensions:
                project: "${{ github.repository }}"
                branch: "${{ github.ref }}"
                event: "${{ github.event_name }}"
                owner: wolfgang
The conditional Dynatrace step within the GitHub workflow above is then executed with every commit of your repository, as it is shown below:

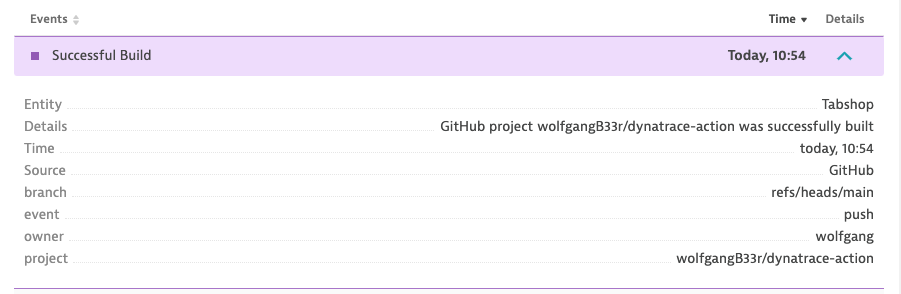
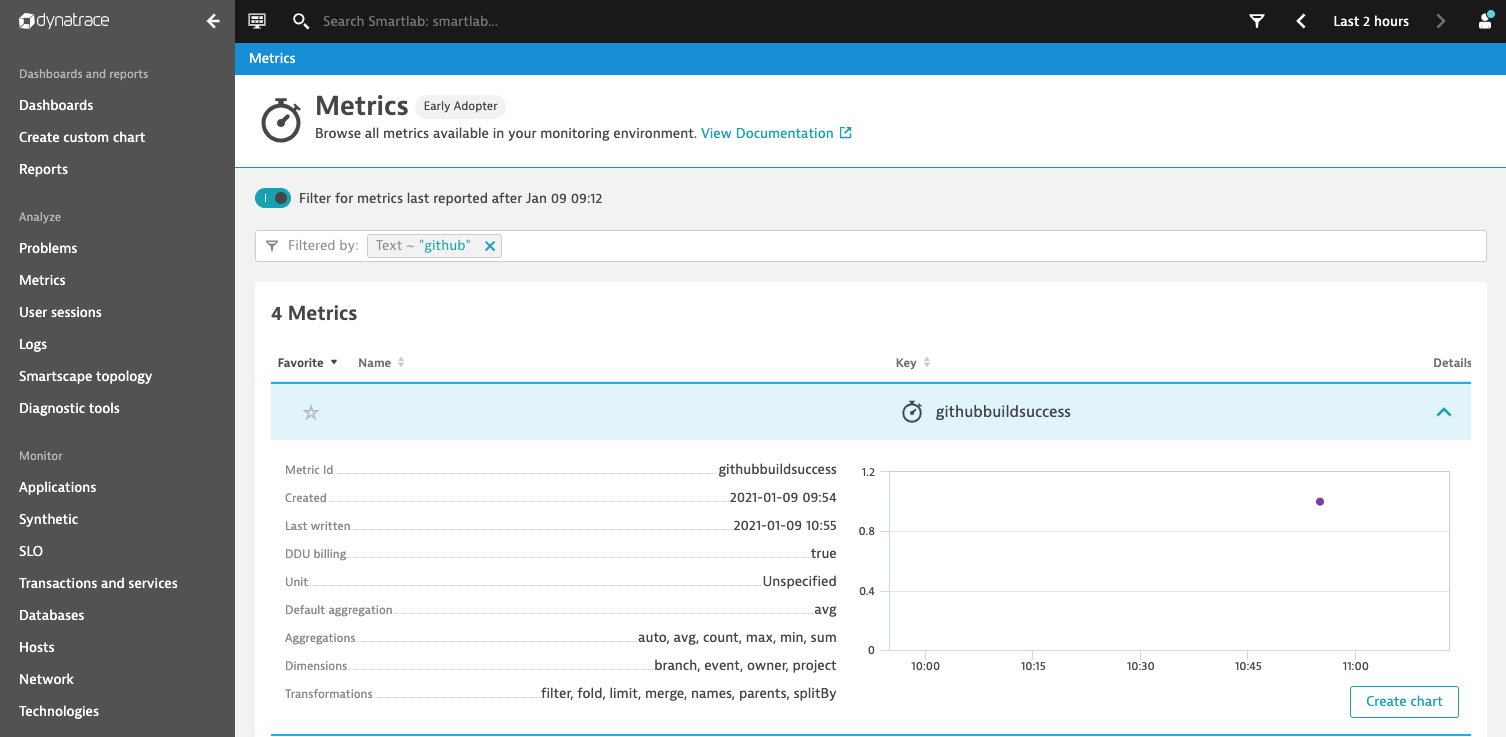
After a successful run of your workflow, you will see both, the event as well as the metric appear in your Dynatrace environment, as it is shown below:
Define a Service-Level-Objective (SLO) for your GitHub CI/CD Pipeline
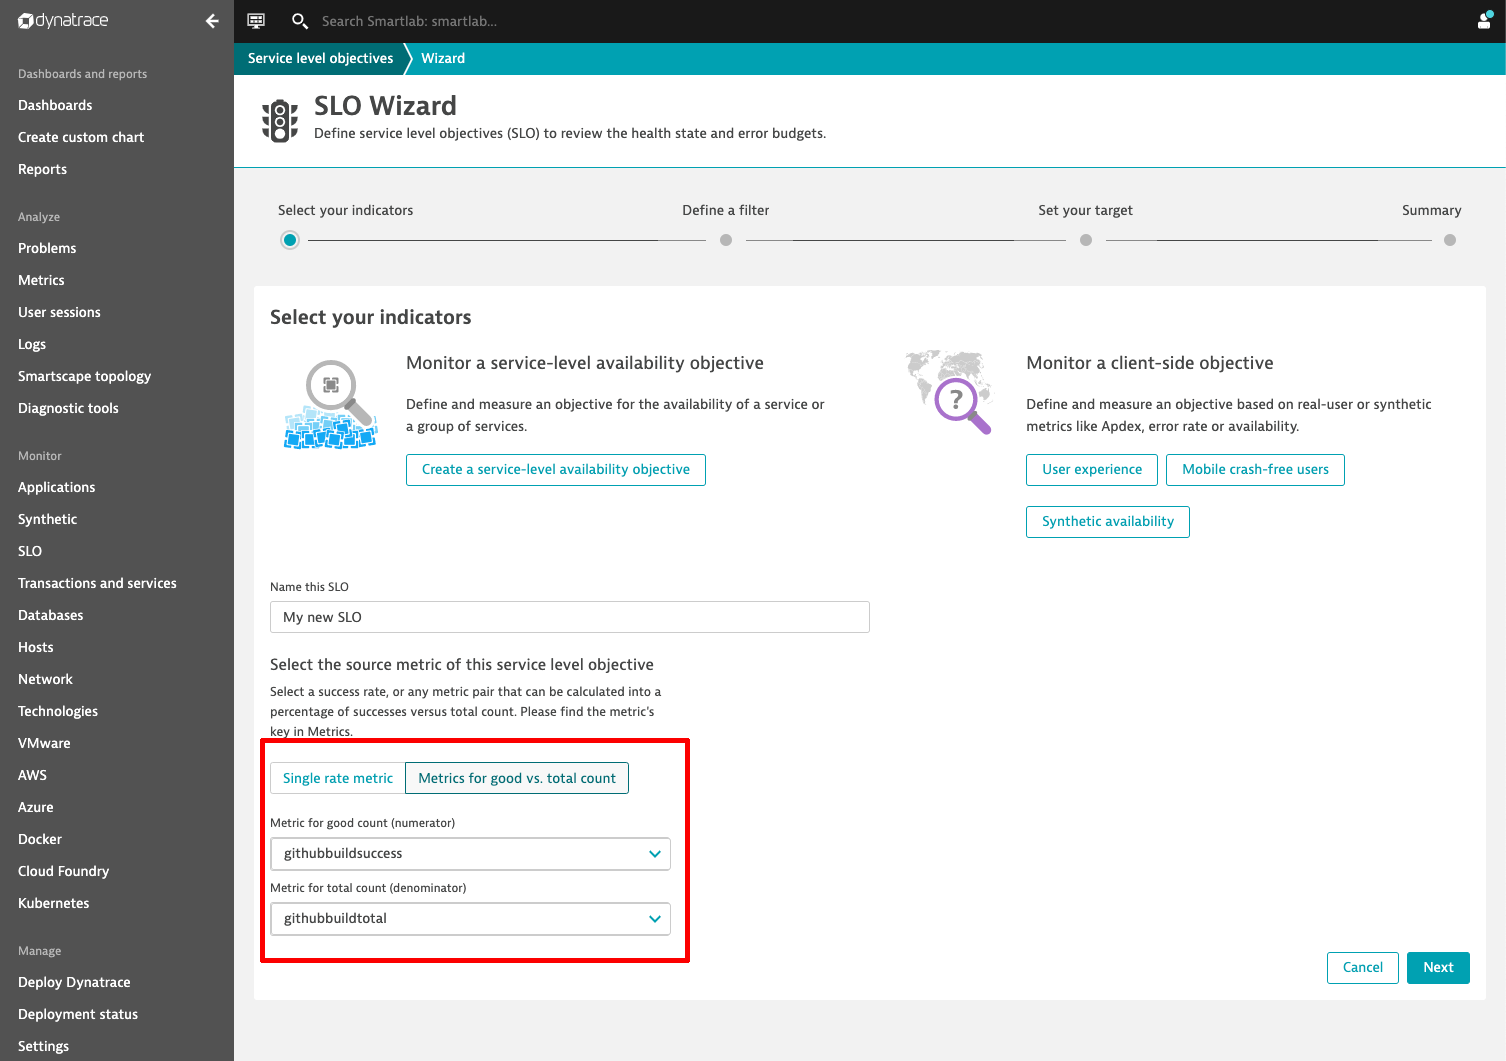
Now that Dynatrace is informed about each build success and fail, we can easily define a SLO for our CI/CD pipeline to continuously observe the quality of our build.
See below the selection of the total count as well as the success count metric as the SLI metric for our SLO within Dynatrace:
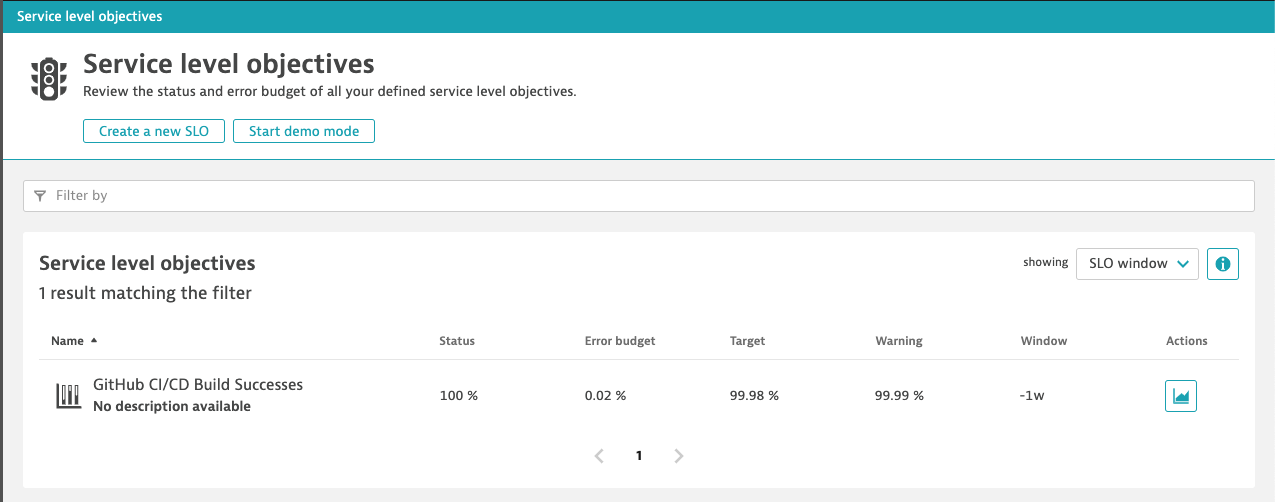
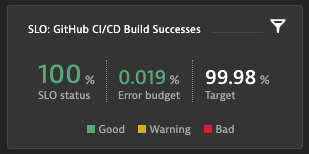
Now we see the current SLO state within the list of Dynatrace SLOs and we can put our SLO state onto any of your Dynatrace dashboards:
Summary
I came to love the simplicity and efficiency of GitHub actions within the last weeks. They helped me a lot to fully automate my own GitHub projects CI/CD pipeline, to save time during releases and to generally raise the quality of my projects.
The logical next step for me was to tightly integrate the GitHub workflow into my Dynatrace monitoring environment and to define SLOs for measuring the quality of my builds in realtime.
By implementing and publishing a Dynatrace GitHub action, a tight integration between your GitHub workflows is now possible for everybody with a simple click into the Github Marketplace.