Getting insights into your users experience as well as into your real users behaviour is key within designing, implementing and delivering web applications as well as mobile applications.
It’s common practice to monitor your web applications or mobile applications performance in production, to gain valuable insights about how well your application performs within your users’ browsers or mobile devices.
As there are ten thousands of different browser and mobile device variants out in the wild, it’s just not enough to test your app on your local machine.
Naturally, the same level of observability and user behaviour monitoring is necessary while building data analysis apps with Streamlit!
Now the question is how to add your own observability support for your own Streamlit app?
Building your own monitoring solution is far beyond reach, especially if you want to capture detailed Waterfall analysis along with backend full stack tracing support.
Therefore, observability platform vendors such as Dynatrace are offering convenient JS agents along with full stack agents to out-of-the-box track any of your web or mobile applications.
Now, the question is how to add a Dynatrace JS agent tag to your own Streamlit application, so that you can follow your real users performance and sessions in real time?
The minimal tracking approach
Streamlit applications are automatically generated by adding widgets that result in rendered HTML snippets.
The first, very minimal tracking approach here is to add a custom component that adds your selected JavaScript tag to your application, as it is shown below:
components.html(“””
   <script type=”text/javascript”
       src=”https://js-cdn.dynatrace.com/jstag/?_complete.js"
       crossorigin=”anonymous”>
   </script>
“””, height=0)
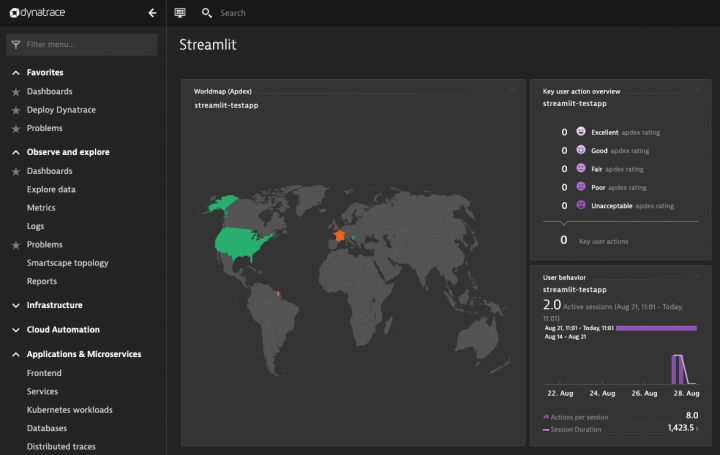
In my case I choose a Dynatrace JavaScript tag that directly reports each real user session into my Dynatrace front-end application monitoring environment.
See my example Dynatrace dashboard below:
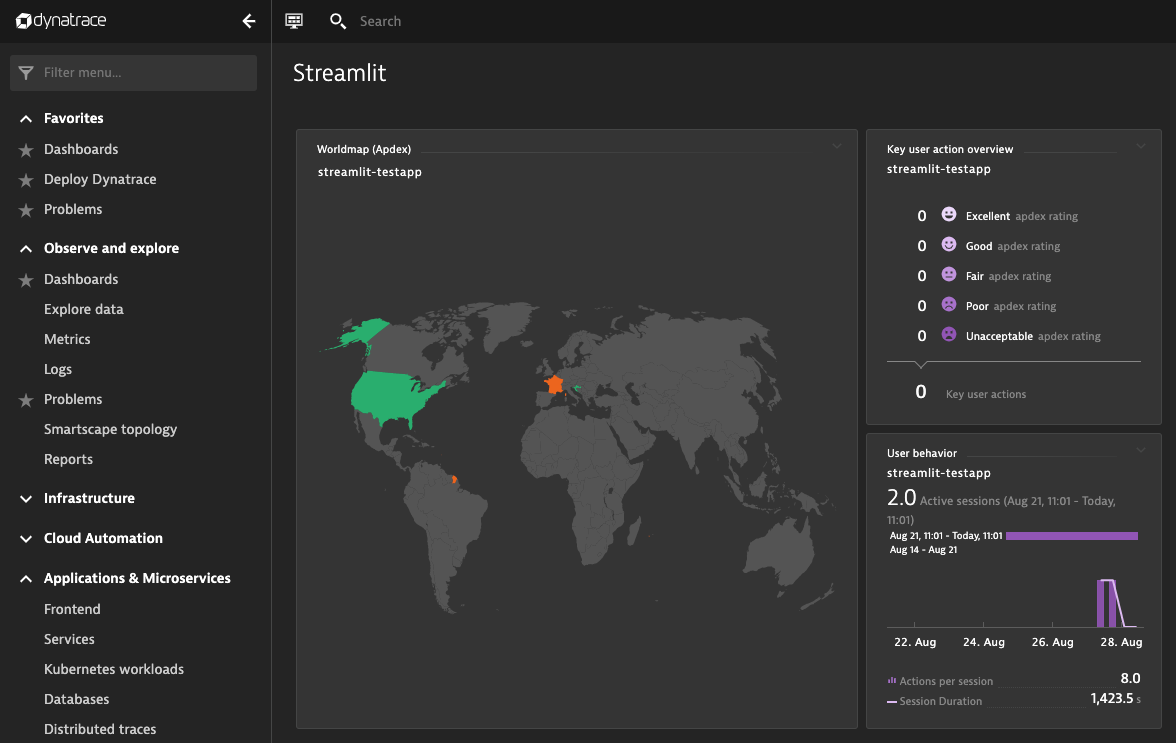
The advantage of that minimal approach is that you work with standard Streamlit components and that you are easily able to gain some first usage statistics about all the real users that are accessing your app.
The huge downside of that minimal tracking approach is that the JS tag is rendered into the custom components iframe, which means it’s not able to track all your apps activity.
The iframe is used to sandbox the code that was added by a custom component and therefore your tracking JS tag is not able to access all the activity.
This means that whatever you add to your Streamlit application is not able to access and modify the global list of JavaScript header includes.
This is unfortunate, as you typically should add your agent include as one of the first includes within the HTML head tag.
The not-so-clean approach
A general way of adding a custom global JavaScript include would perfectly solve that issue, but it seems that this discussion within the Streamlit community is still ongoing.
Meanwhile, there is a little workaround that allows us to modify the Streamlit html template file and add our own JavaScript tag into the head section.
Instead of manually changing that template file, which resides in the folder ‘/usr/local/lib/python3.7/site-packages/streamlit/static/index.html’, we will add a tiny Python function that automatically performs that job for us.
The Python function will load the template file and add any given JavaScript at the beginning of the HTML head section.
Find this Python routine below:
import streamlit as st
import streamlit.components.v1 as components
import numpy as np
import os

def inject(tag):
  with open(os.path.dirname(st.__file__) +
     “/static/index.html”, ‘r’) as file:
  str = file.read()
  if str.find(tag) == -1:
    idx = str.index(‘<head>’)
    new_str = str[:idx] + tag + str[idx:]
    with open(os.path.dirname(st.__file__)
       + “/static/index.html”, ‘w’) as file:
      file.write(new_str)


inject(‘<script type=”text/javascript” src=”https://js-cdn.dynatrace.com/jstag/
“></script>’)
After adding that routine to your Streamlit app, the resulting HTML page will have the specified JavaScript included within the global HTML head section, as it is shown below:
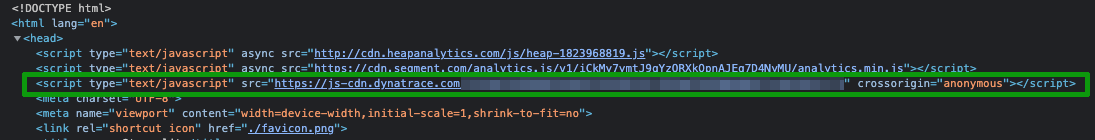
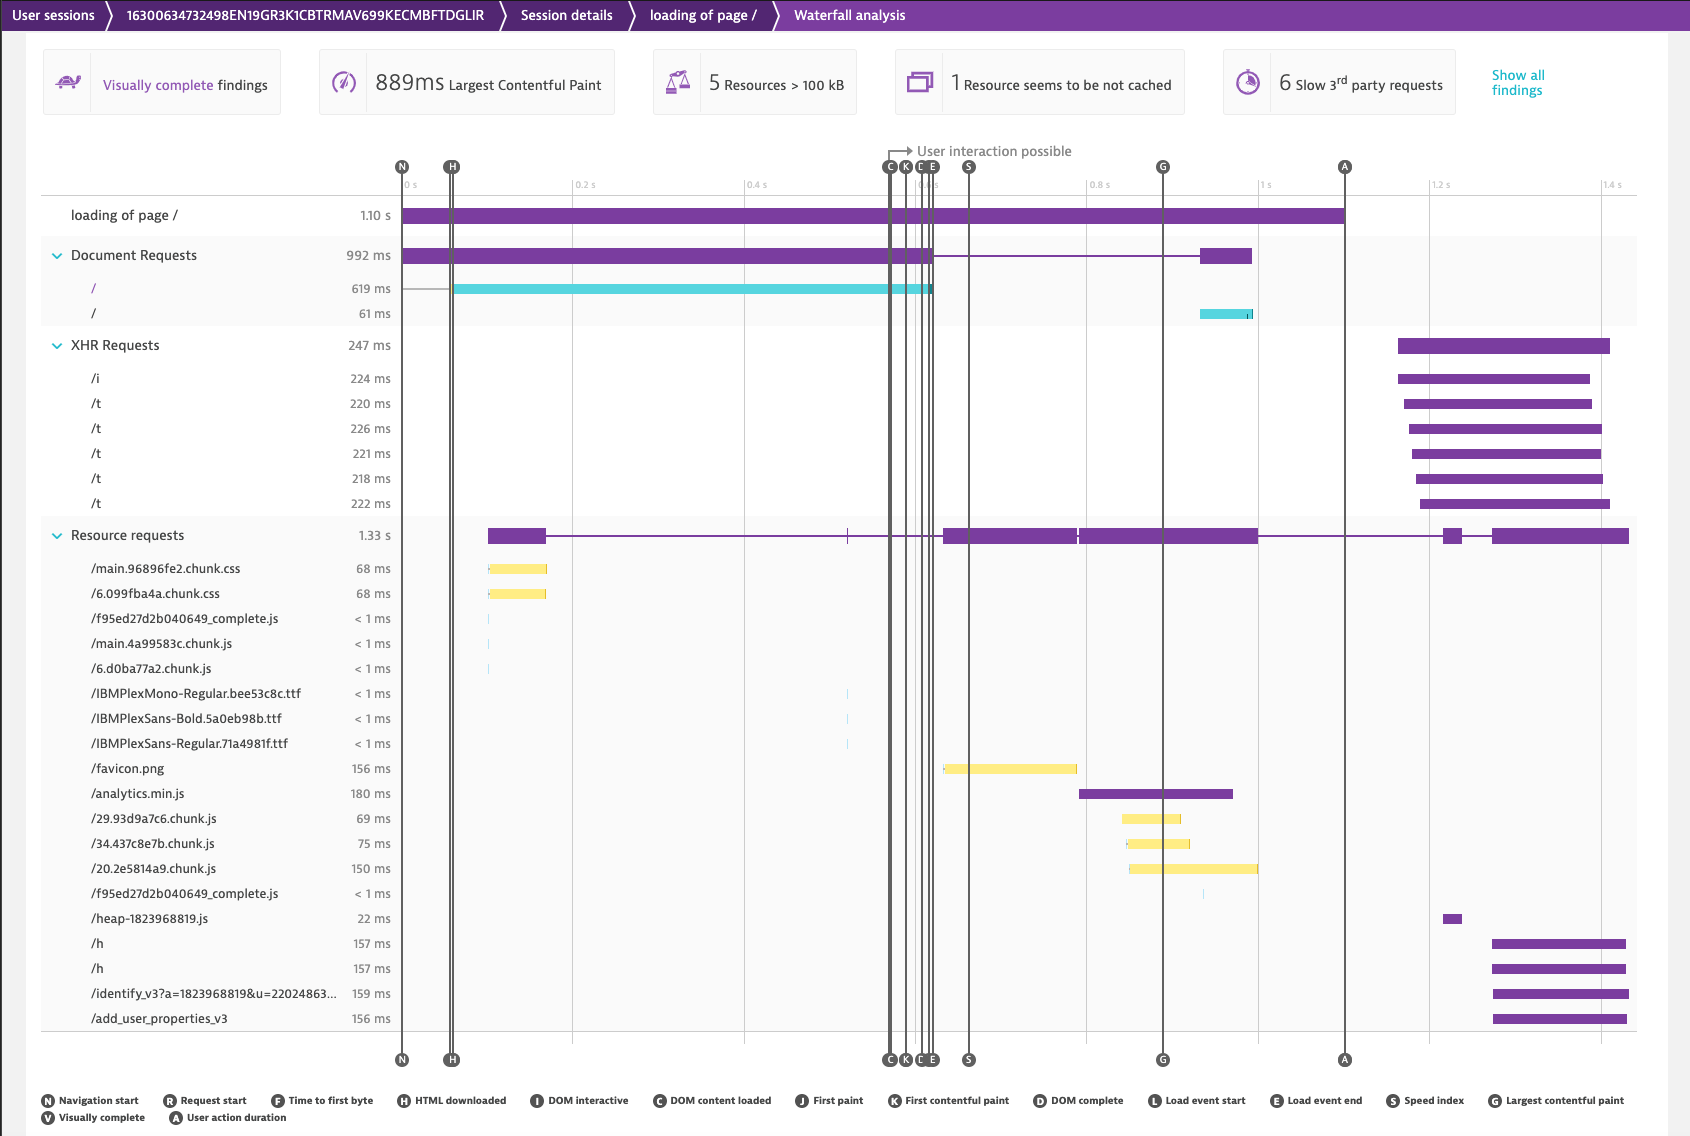
As a result, our JavaScript agent is included at the beginning and is able to collect all the valuable insights about the resource loading time of your own Streamlit app.
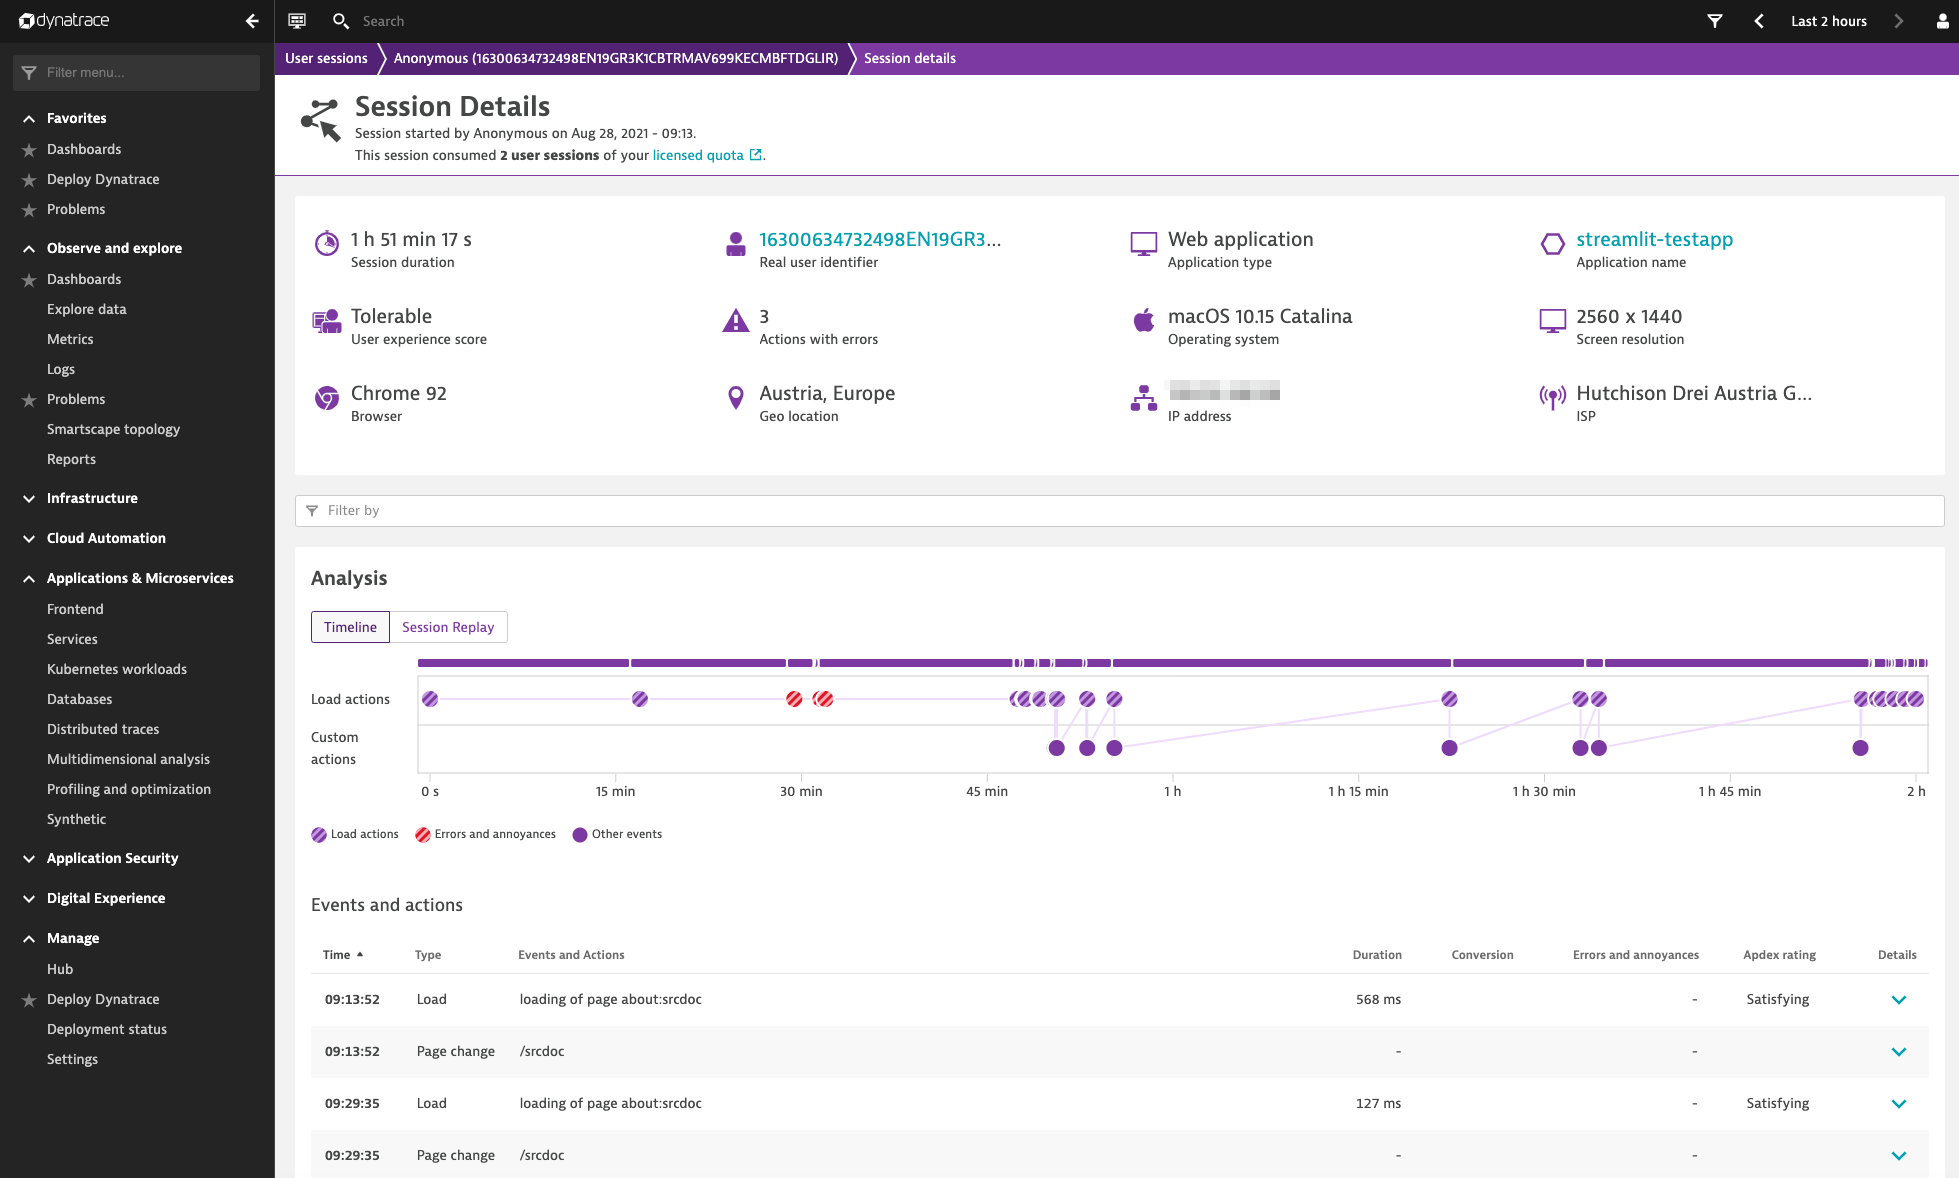
The screenshot below shows a typical Dynatrace waterfall analysis of my running Streamlit app, where all the resource loading times and user actions are measured in terms of performance and errors:
Summary
Observability and real user application monitoring is crucial in order to understand how your customers are experiencing the performance and stability of your application.
It does not matter if you are implementing and deploying a traditional web application, a native mobile app or a Streamlit data app, gaining insights into your applications performance and stability helps to improve its usability and to push adoption.
By adding some lines of Python code, it is easily possible to add any JavaScript agent tag directly into your Streamlit app and therefore transform your data app into a transparent and observable application.
Thanks a lot for reading, I hope my article helped to gain observability into your own Streamlit data app.