Highly dynamic change in IT service topology is inevitable in modern automated deployment and delivery platforms such as Kubernetes (K8S).
Tracing those micro-service IT service environments is hard to grasp for a human, as those traces and deployment stacks consists of millions, yes even billions of monitored entities.
One of the unique benefits of rolling out a Dynatrace OneAgent within your software environment is its ability to automatically discover the deployment stack of your running software services and to deliver traces end-to-end from each individual caller to all backend service dependencies.
So far, Dynatrace automatic discovery of your topology recognises around 150 built-in types, such as hosts, processes, services, web applications or even mobile applications. Besides those built-in types, the topology can be enhanced by your own entity types along with their relationships.
As the Dynatrace observability platform was built with automation in mind, it offers all that topology information through its feature-rich entity REST API.
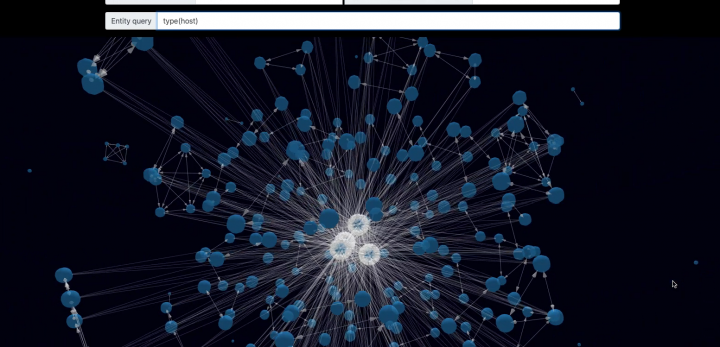
Three.js the popular cross-browser 3D WebGL visualisation framework is the perfect tool to graph those Dynatrace discovered service and IT topologies in 3D directly within a browser. A standalone, single page application allows to execute variable topological queries and to visualise the results. Due to the fact that WebGL is a highly optimised 3D rendering framework, this topological browser is able to graph several thousand nodes and their relationships within your browser, as it is shown in the video below.
The html and three.js based topology browser is available on GitHub.