Over the last couple of years, OpenTelemetry became the de-facto instrumentation standard for collecting and observing distributed service trace information.
OpenTelemetry allows users to add standardized instrumentation code within their applications with the purpose of observing traces, metrics, logs and events independent of service implementation technologies and across all the major cloud vendors.
Within this post, we will implement a simple Python service and instrument it with OpenTelemetry.
We will then ship the Python service as a Docker image, deploy it within Google cloud and finally collect distributed trace data by using OpenTelemetry within Dynatrace.
This blog post will give you an end-to-end example on how to instrument Python services with OpenTelemetry to make them observable.
As OpenTelemetry represents an open standard of telemetry data exchange, those instrumented services can be observed by any OpenTelemetry supporting monitoring platform, such as Dynatrace and you can deploy and run them in any of the large clouds (e.g.: AWS, GCP, Azure).
Implement the service in Python
Let us first implement a first service in Python that opens a port and serves a simple JSON through HTTP protocol.
We use the convenient Flask web framework (pip install flask) to serve our Python microservice endpoints, as it is shown below:
from flask import Flask
import json

app = Flask(__name__)

@app.route('/')
def home():
   ret = {
       'path' : 'home'
   }
   # now call an internal service method
   products()
   # then return
   return json.dumps(ret)

@app.route('/products')
def products():
   ret = {
       'path' : 'products'
   }
   return json.dumps(ret)
To run the Flask app locally, you first need to export the application name as shown below and then run the app with the command flask run.
export FLASK_APP=app
flask run
On the console Flask informs about the local Web address serving its content.
iMac:python-otel-demo-service wolfgang$ flask run
 * Serving Flask app 'app' (lazy loading)
 * Environment: production
   WARNING: This is a development server. Do not use it in a production deployment.
   Use a production WSGI server instead.
 * Debug mode: off
 * Running on http://127.0.0.1:5000/ (Press CTRL+C to quit)
Instrument your service code with OpenTelemetry
In the next step we will manually instrument the service code with OpenTelemetry so that we gain a step-by-step OpenTelemetry example.
First we need to install the OpenTelemetry Python packages as shown below:
pip install opentelemetry-api
pip install opentelemetry-sdk
Once the OpenTelemetry packages are successfully installed, we can begin to instrument our simple service code.
Import statements as well as the creation of the trace provider are added at the beginning and each function gets its own span report.
from flask import Flask
import json


from opentelemetry import trace
from opentelemetry.sdk.trace import TracerProvider
from opentelemetry.sdk.trace.export import (
   BatchSpanProcessor,
   ConsoleSpanExporter,
)

from opentelemetry.sdk.resources import Resource


trace_provider = TracerProvider(resource=Resource.create({
           "service.name": "shoppingcart",
           "service.instance.id": "instance-12",
       }),)
processor = BatchSpanProcessor(ConsoleSpanExporter())
trace_provider.add_span_processor(processor)

# Sets the global default tracer provider
trace.set_tracer_provider(trace_provider)

# Creates a tracer from the global tracer provider
tracer = trace.get_tracer(__name__)

app = Flask(__name__)

@app.route('/')
def home():
   with tracer.start_as_current_span("home") as span:
       span.set_attribute("operation.value", 1)
       span.set_attribute("operation.name", "home")
       ret = {
           'path' : 'home'
       }
       # now call an internal service method
       products()
       # then return
       return json.dumps(ret)


def products():
   # add this span as child into the current trace
   with tracer.start_as_current_span("products") as child:
       child.set_attribute("operation.product.count.value", 99)
       child.set_attribute("operation.name", "products")
       ret = {
           'path' : 'products'
       }
       return json.dumps(ret)
After instrumenting the service code as it was shown above we can open a local Web browser, load the local page on http://127.0.0.1:5000/ and the OpenTelemetry trace exporter will dump the resulting traces within your local command console, as it is shown below:
127.0.0.1 - - [09/Feb/2023 17:01:32] "GET / HTTP/1.1" 200 -
{
    "name": "products",
    "context": {
        "trace_id": "0x97463cd269b25ed39994d2d0b191851c",
        "span_id": "0xa1c3a89ade55fdaa",
        "trace_state": "[]"
    },
    "kind": "SpanKind.INTERNAL",
    "parent_id": "0xe161a905283e6bac",
    "start_time": "2023-02-09T16:01:32.010948Z",
    "end_time": "2023-02-09T16:01:32.011069Z",
    "status": {
        "status_code": "UNSET"
    },
    "attributes": {
        "operation.product.count.value": 99,
        "operation.name": "products"
    },
    "events": [],
    "links": [],
    "resource": {
        "attributes": {
            "telemetry.sdk.language": "python",
            "telemetry.sdk.name": "opentelemetry",
            "telemetry.sdk.version": "1.15.0",
            "service.name": "shoppingcart",
            "service.instance.id": "instance-12"
        },
        "schema_url": ""
    }
}
{
    "name": "home",
    "context": {
        "trace_id": "0x97463cd269b25ed39994d2d0b191851c",
        "span_id": "0xe161a905283e6bac",
        "trace_state": "[]"
    },
    "kind": "SpanKind.INTERNAL",
    "parent_id": null,
    "start_time": "2023-02-09T16:01:32.010845Z",
    "end_time": "2023-02-09T16:01:32.011138Z",
    "status": {
        "status_code": "UNSET"
    },
    "attributes": {
        "operation.value": 1,
        "operation.name": "home"
    },
    "events": [],
    "links": [],
    "resource": {
        "attributes": {
            "telemetry.sdk.language": "python",
            "telemetry.sdk.name": "opentelemetry",
            "telemetry.sdk.version": "1.15.0",
            "service.name": "shoppingcart",
            "service.instance.id": "instance-12"
        },
        "schema_url": ""
    }
}
With that we finished instrumenting our simple service and we will start to build a Docker container that allows us to run our OpenTelemetry monitored service in any containerized cloud environment.
Create and upload the Docker image to Dockerhub
GitHub actions within your GitHub repository are a great feature that allows you to automatically build your Docker image on code commits.
In order to build a Docker image, the projects Dockerfile needs to be located within our service GitHub project, as it is shown below:
FROM python:3.8-slim-buster

WORKDIR /app

COPY requirements.txt requirements.txt
RUN pip3 install -r requirements.txt

COPY . .

CMD [ "python3", "-m" , "flask", "run", "--host=0.0.0.0"]
As our service represents a Python implementation we also need to create a text file listing all requirements (requirements.txt).
flask
opentelemetry-api
opentelemetry-sdk
Now, I create a GitHub workflow to automatically checkout the code of my service, build the Docker container and upload the resulting image to my DockerHub registry:
name: Docker Image CI


on:
 push:
   branches: [ "main" ]
 pull_request:
   branches: [ "main" ]


jobs:


 build:
   runs-on: ubuntu-latest


   # Steps represent a sequence of tasks that will be executed as part of the job
   steps:
     - name: Set up QEMU
       uses: docker/setup-qemu-action@v1
     - name: Set up Docker Buildx
       uses: docker/setup-buildx-action@v1
     - name: Login to DockerHub
       uses: docker/login-action@v1
       with:
         username: ${{ secrets.DOCKERHUB_USERNAME }}
         password: ${{ secrets.DOCKERHUB_TOKEN }}
     - name: Build and push
       id: docker_build
       uses: docker/build-push-action@v2
       with:
         push: true
         tags: wolfgangb33r/python-otel-demo-service
     - name: Image digest
       run: echo ${{ steps.docker_build.outputs.digest }}
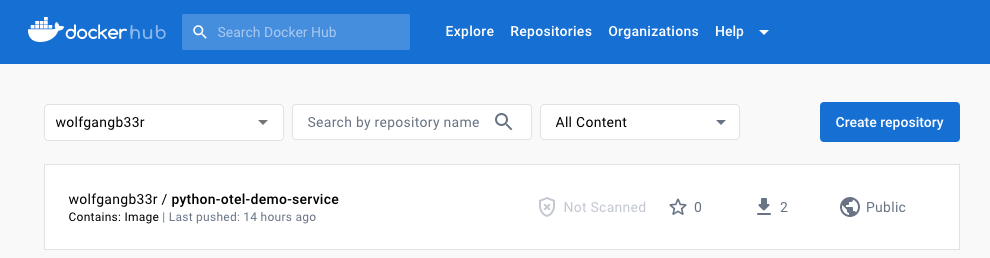
After a GitHub commit, the GitHub action will automatically build and upload my Docker service image, as it is shown below:
Pull your service image in Google Cloud
Now lets host and run our newly built Python service within Google Cloud Run. For that we navigate to the Google Cloud Console and open the Cloud Shell within your browser.
Within your Cloud Shell you pull your Docker image from Dockerhub by typing the following command:
$docker pull wolfgangb33r/python-otel-demo-service
Using default tag: latest
latest: Pulling from wolfgangb33r/python-otel-demo-service
29cd48154c03: Pull complete
2c59e55cfd71: Pull complete
Digest: sha256:e3790df6cf96ab2ed00352d450d9ada00af7388a3f08f46e9f28e834aa9144c1
Status: Downloaded newer image for wolfgangb33r/python-otel-demo-service:latest
docker.io/wolfgangb33r/python-otel-demo-service:latest
After pulling the image, we need to check which image identifier was assigned to our local image by listing all the images hosted in your Google Cloud project:
$docker images
cloudshell:~ (myplayground-311913)$ docker images
REPOSITORY                              TAG       IMAGE ID       CREATED       SIZE
wolfgangb33r/python-otel-demo-service   latest    ed0506db6474   2 hours ago   129MB
Now tag your image by using the correct image id that was shown before within the listed images. In my case this id is: ed0506db6474. You also need to replace the project-id with your own Google Cloud project id:
$docker tag ed0506db6474 gcr.io/{project-id}/python-otel-demo-serviceFinally, push the newly tagged image to your Google Cloud project’s Docker registry:
$docker push gcr.io/{project-id}/python-otel-demo-serviceRun the Python service in Google Cloud Run
Navigate to Google Cloud Run within your Google Cloud Console. Click on create a new service to run your Docker container as a managed service.
Select your Docker container and start to provision a new instance of your Docker container, as it is shown below:
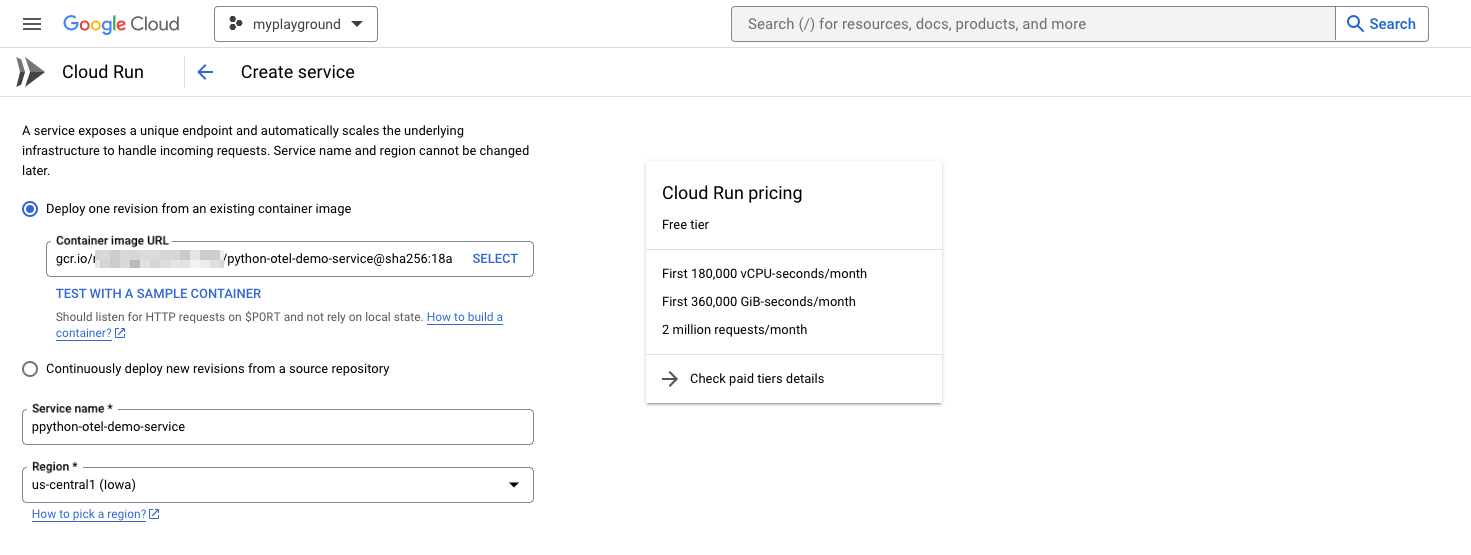
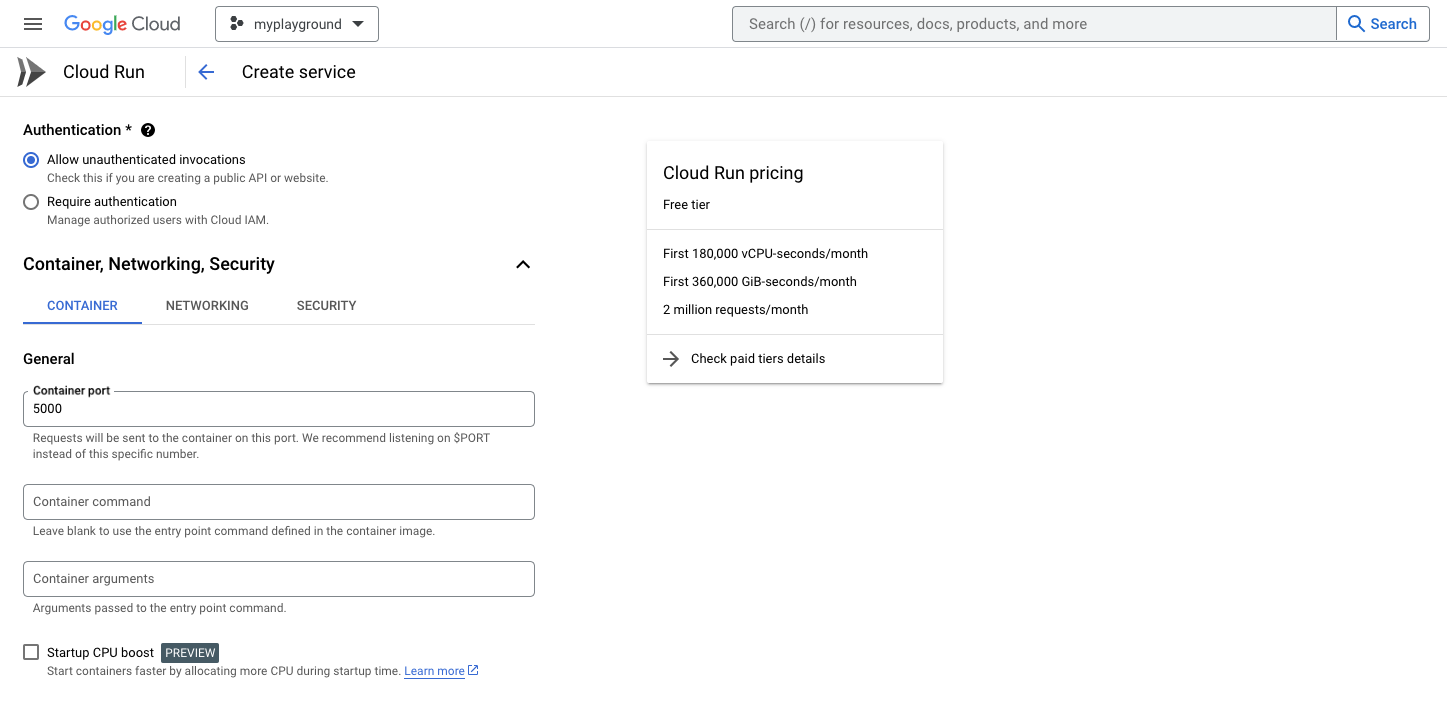
Make sure to set the network port to your services Flask port 5000 to be able to route traffic to your service!
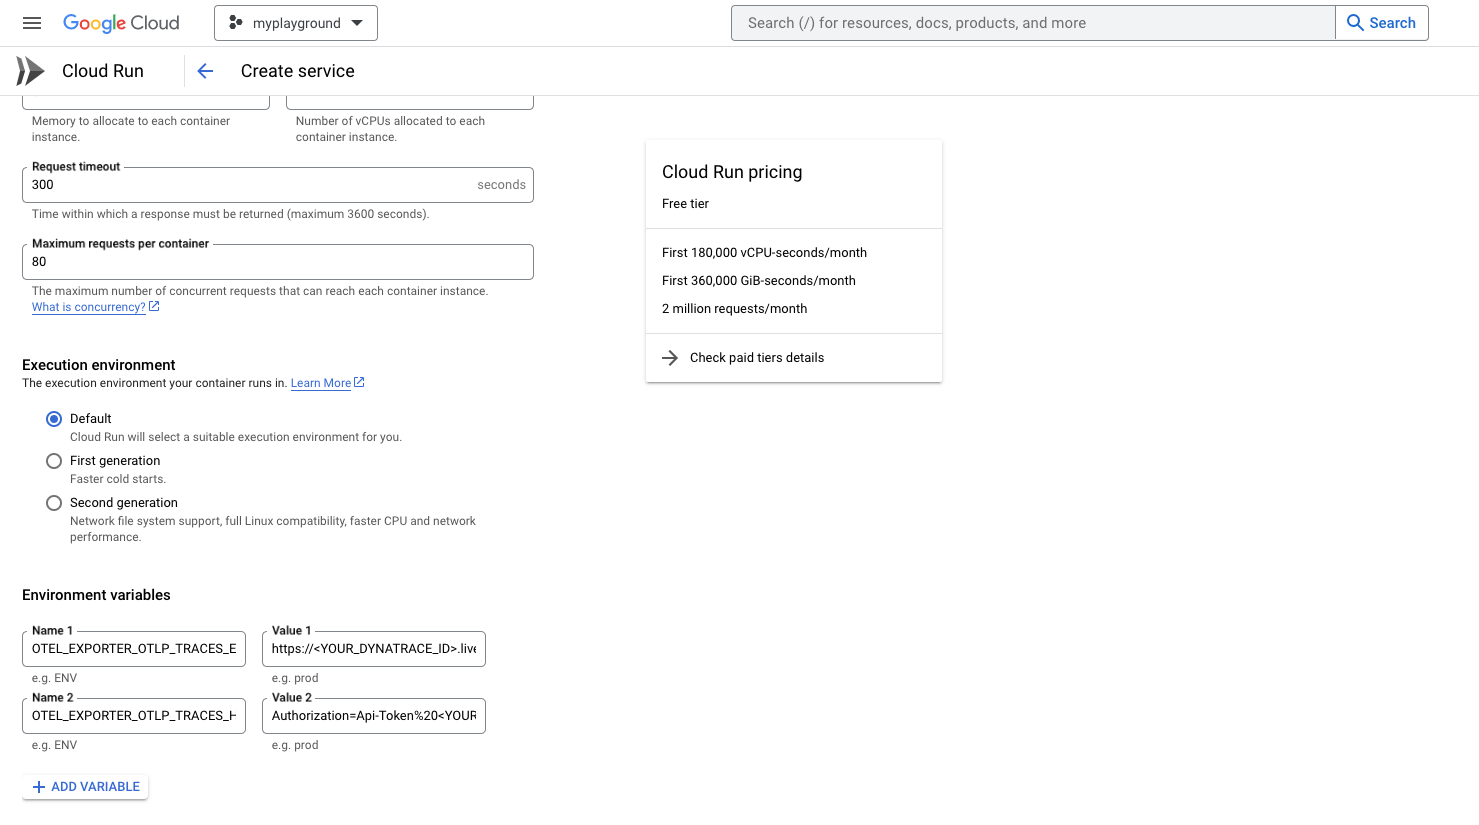
Before you create the service you need to set two environment variables that define where the OpenTelemetry information is sent to. The next section will show how to set those two environment variables within your GCP service creation page.
Observe the Python Service in Dynatrace
To decouple the configuration of the telemetry backend receiver from your application implementation, environment variables should be used to configure the URL as well as the authorization headers. In that way, you can flexibly set and change the receiver of the OpenTelemetry information during the deployment of your application without the need to change the applications instrumentation code.
Use the environment variables ‘OTEL_EXPORTER_OTLP_TRACES_ENDPOINT’ and ‘OTEL_EXPORTER_OTLP_TRACES_HEADERS’ to define where the spans should be sent to. See an example below that shows how to set a Dynatrace environment to receive the OpenTelemetry spans:
export OTEL_EXPORTER_OTLP_TRACES_ENDPOINT=https://<YOUR_DYNATRACE_ID>.live.dynatrace.com/api/v2/otlp/v1/traces
export OTEL_EXPORTER_OTLP_TRACES_HEADERS="Authorization=Api-Token%20<YOUR_DYNATRACE_API_TOKEN>"
The instrumentation code of the Flask application has been modified to not only send the spans to the local console but also to a OLTP span exporter.
Be aware that the value of the headers environment variable in OTEL_EXPORTER_OTLP_TRACES_HEADERS needs to be URL encoded, which means that the space character between Api-Token and the secret needs to be replaces with ‘%20’!
During the creation of your service, scroll down to the environment variables section and create those two environment variables, as it is shown below:
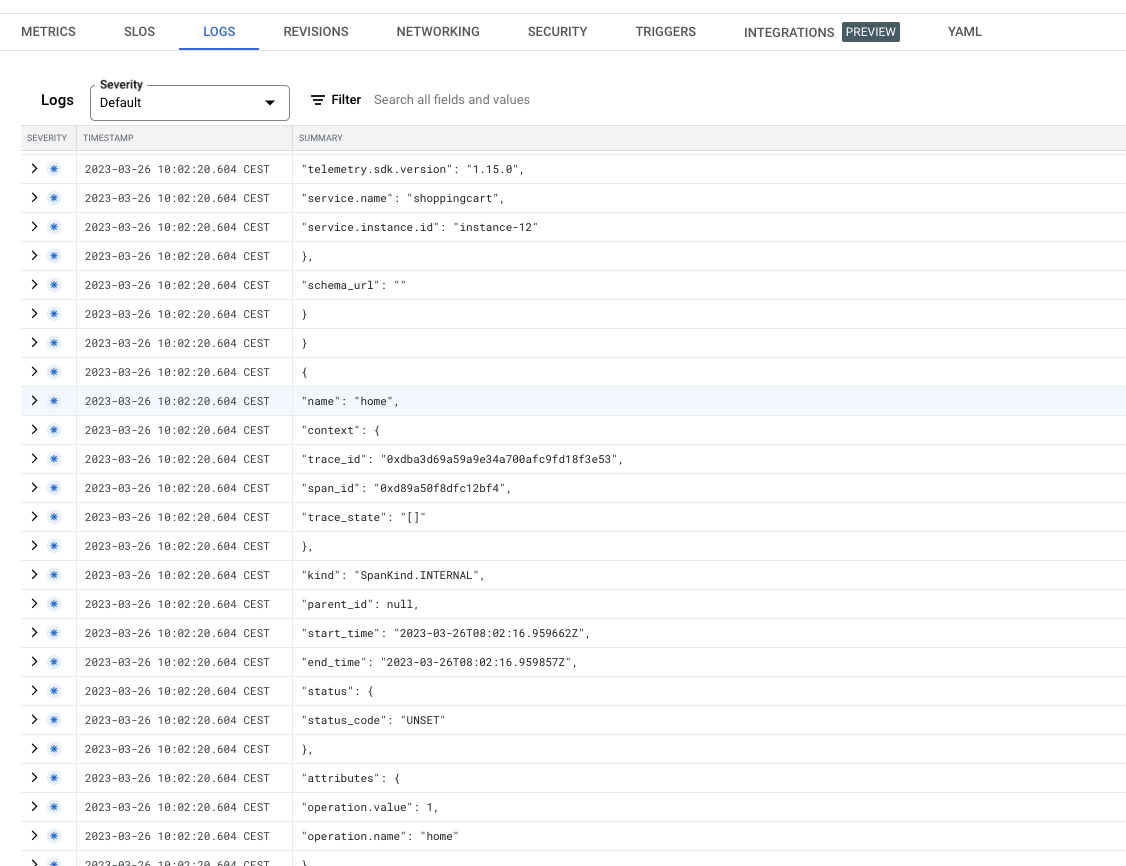
Finish the configuration of your newly deployed Google Cloud Run service and open the provided URL endpoint of your service within your browser.
If everything was successful, you will see the OpenTelemetry console export logs within the logs tab of your Cloud Run service as shown below:
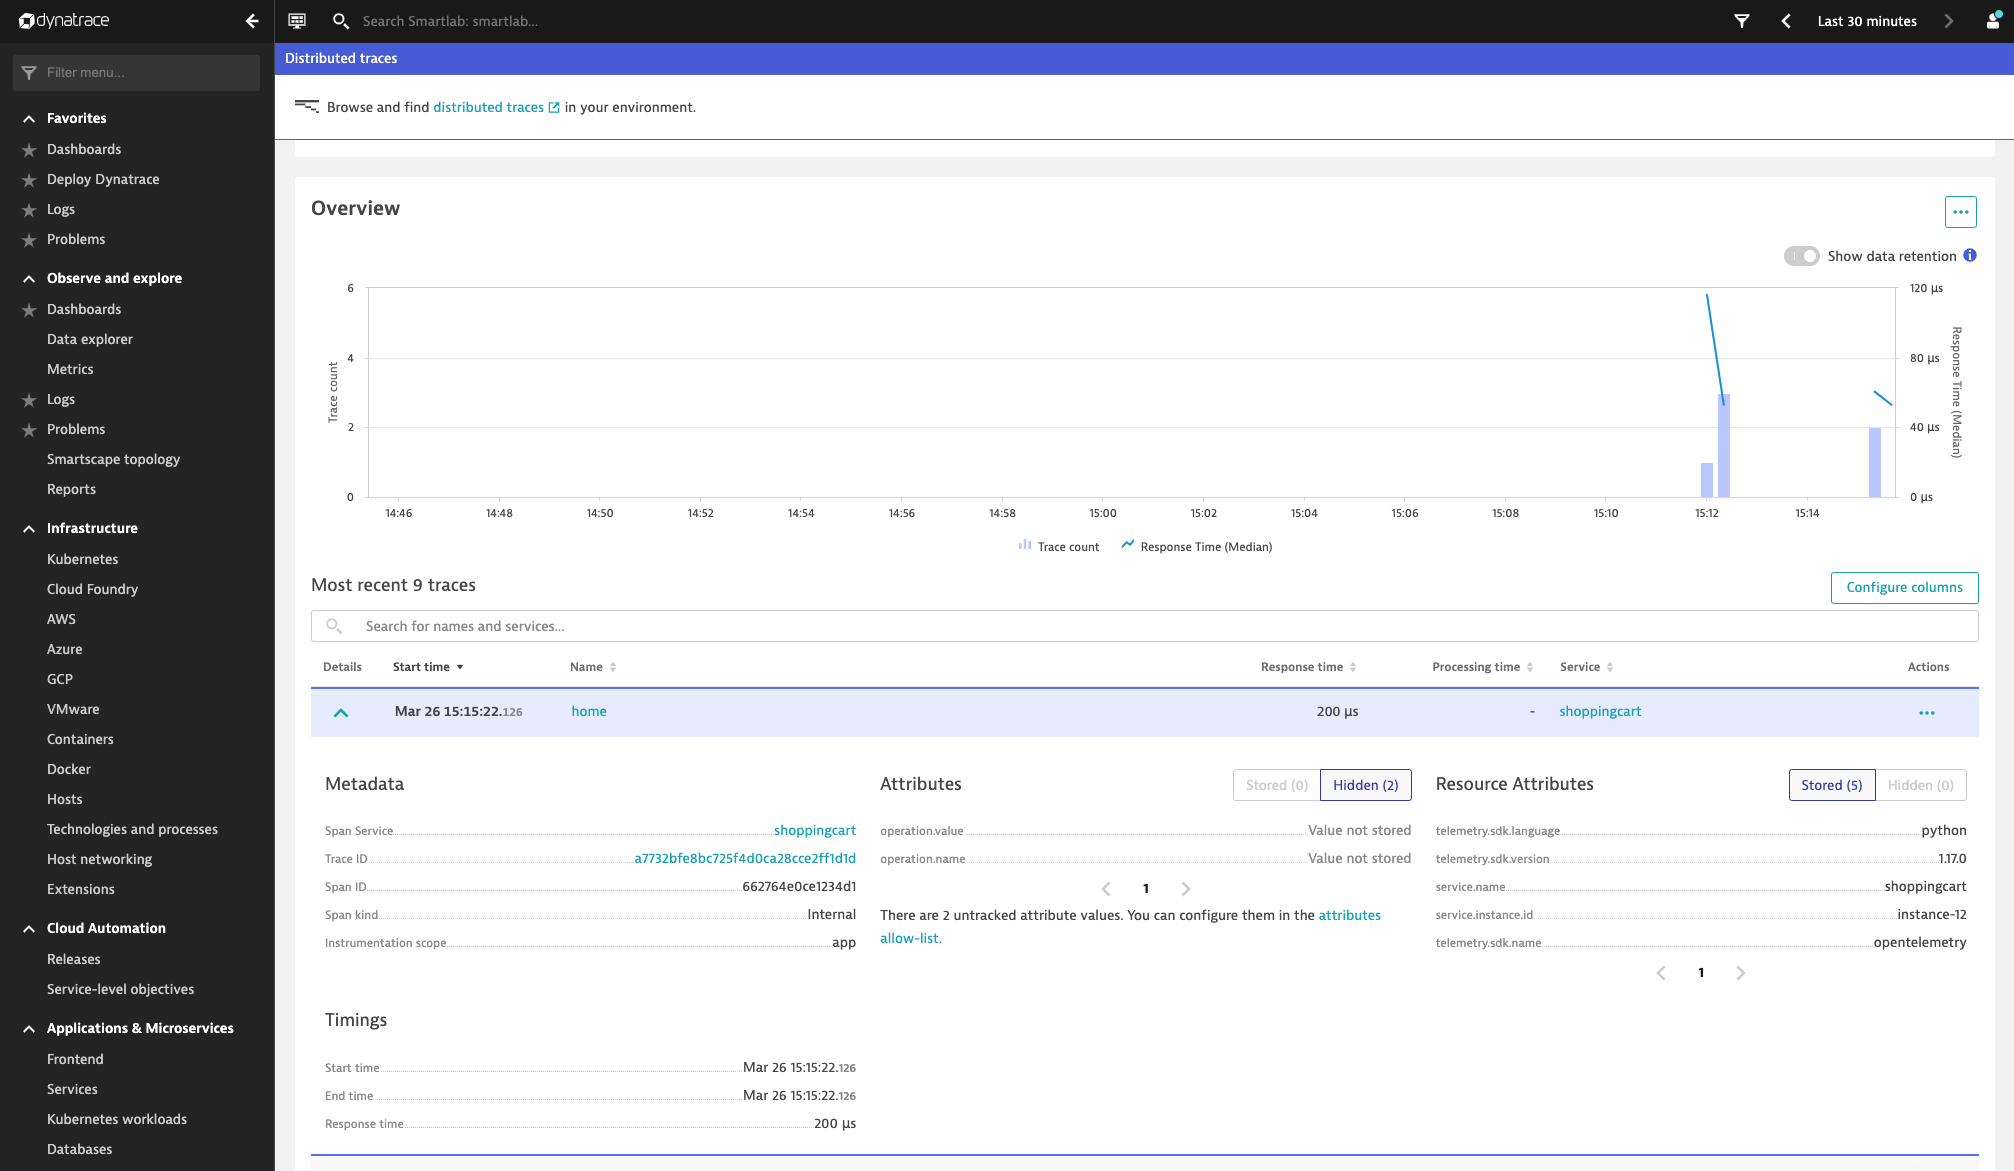
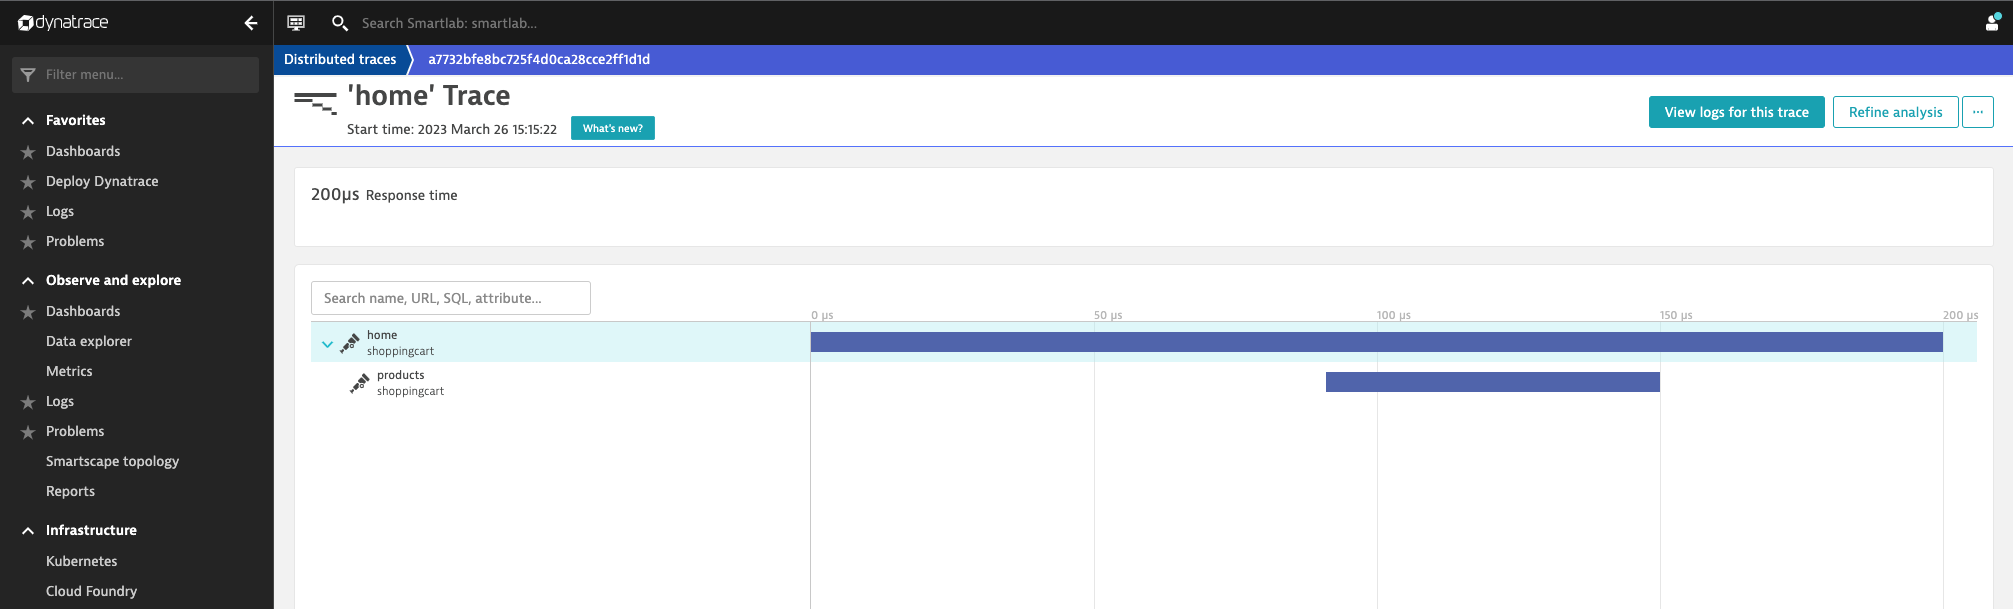
If you also successfully configured the Dynatrace endpoint variables, you will see the OpenTelemetry traces streaming in within Dynatrace. See below the Dynatrace distributed traces page along with the Dynatrace trace details page:
Summary
OpenTelemetry is a great instrumentation standard for observing your distributed cloud native applications. It offers a lot of flexibility and it embraces developers by offering all the necessary APIs, SDKs along with convenient exporters no matter if you only want to dump your traces in your local console or if you want to further analyze them in a telemetry backend such as Dynatrace.
Combining OpenTelemetry, Docker, Google Cloud Run along with a Dynatrace monitoring environment offers tremendous flexibility and transparency during the development and deployment of your applications.
Find all the source code and the step-by-step OpenTelemetry course in my ‘OpenTelemetry-Course‘ GitHub repository.