Streamlit is one of the hottest topics around the data science community at the moment. I came across Streamlit when our data science team presented their results in a web application that looked that professional that I simply couldn’t believe how they could build that app in so little time (and not having designers and UI people involved…).
Streamlit is an open-source library, dedicated to the data science and Python community that makes it easy to create and share beautiful, custom web apps for data visualisation, machine learning and data science.
Why Streamlit is great?
Streamlit is beautifully designed and deadly simple to use!
I confirm what other users said about Streamlit: its definitely worth a try, as the time investment is that low that you can write and deploy a beautifully designed, purpose built data analysis application within two hours and with less than 100 lines of Python code.
Why to deploy with Docker?
Don’t waste time with a local Streamlit installation, use Docker right away. I have to admit that I was too stupid to get it run on my Windows laptop nor at my iMac. I struggled with several dependency and Python environment issues, until I realised that its much easier and without hassle to develop and deploy the Streamlit app with Docker right from the beginning.
To run a Streamlit application with Docker you just need to create a Dockerfile that is derived from the base Python Docker image, as shown below:
FROM python:3.7
EXPOSE 8501
WORKDIR /app
COPY requirements.txt ./requirements.txt
RUN pip3 install -r requirements.txt
COPY . .
CMD streamlit run app.py
Don’t forget to put the Python library requirements.txt file into the same folder, as it is shown below:
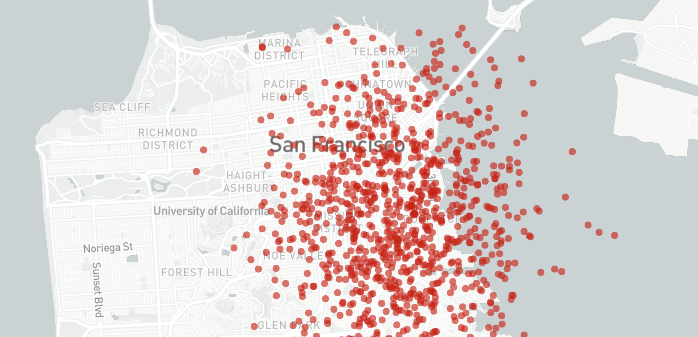
streamlitFinally, implement your Streamlit application within the app.py file. I already added two Streamlit widgets, one for showing a chart with some random time series data in it as well as a geographic map widget that shows random longitude and latitude locations in the Bay area.
import streamlit as st
import numpy as np
import pandas as pd

st.title('Dimensional Data Analysis')

chart_data = pd.DataFrame(
     np.random.randn(20, 3),
     columns=['a', 'b', 'c'])

st.line_chart(chart_data)

map_data = pd.DataFrame(
    np.random.randn(1000, 2) / [50, 50] + [37.76, -122.4],
    columns=['lat', 'lon'])
Now lets build the Docker container by typing in following command:
$ docker build -f Dockerfile -t app:latest .
Finally, run your Streamlit application by starting the previously composed Docker container:
$ docker run -p 8501:8501 app:latest
Now you can access your Streamlit data dashboard through your local HTTP address on the exposed port 8501. Just open your browser and navigate to ‘localhost:8501’ which will lead you to your newly created Streamlit data dashboard, as it is shown below:
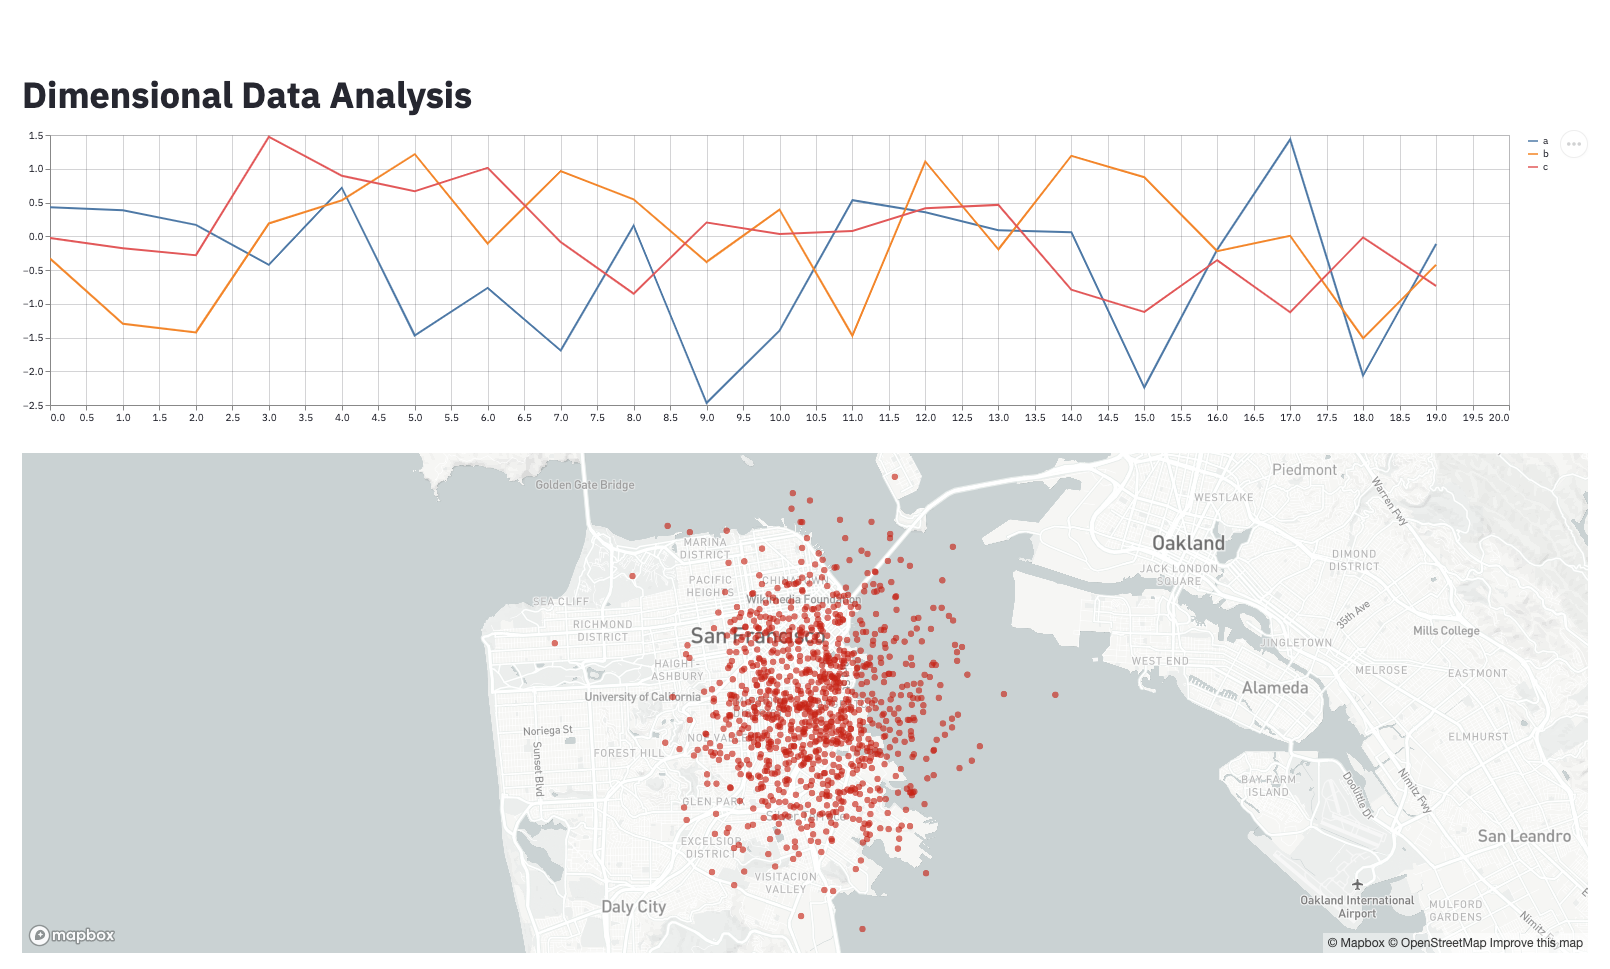
The nice thing about Streamlit is that you don’t need any interaction code nor visualization markup or styling. Everything is already built in, along with options to conveniently zoom all charts and maps as well as to export any chart into any kind of format such as CSV or images.
This saves a tremendous amount of time and it lets you focus on the essence of your work, which is not to stumble around with css files and thousands of JavaScript frameworks, but much more to focus on the value and data visualisation and analysis.
Deploy publicly on share.streamlit.io
Finally, coming to the ultimate benefit of having the Streamlit application built as a Docker container right from the start, which is to share and to deploy your app on share.streamlit.io.
It seems that Streamlit sharing for now is on invite only, but you can easily request request an invite here.
In order to share and deploy your app you just have to follow these 3 simple steps:
- Create a public GitHub repository and put those 3 files of your app into that repository.
- Sign into share.streamlit.io
- Click ‘Deploy an app’ and then paste in your GitHub URL